
Robservations #16: Using the MapBox API with Leaflet
Want to share your content on R-bloggers? click here if you have a blog, or here if you don't.
Introduction
Using Mapbox is a wonderful way to create beautiful maps with leaflet. In my last blog, I spoke about reverse engineering Atlas.co and how to create maps that are similar to the maps produced there. After a bit of Googling I was lead to this post where I found the following info on using the MapBox API with leaflet in R; with a little bit of playing around with MapBox Studio I managed to make a themes that would be appropriate for making souvenieur maps.
In this short blog post I share a small update in the code I wrote in my last blog which makes a huge difference aesthetically.
The code
The updated function has a new argument accounting for a custom MapBox template. However, I did remove a provider as including it seemed unneccessary to have. So to keep the option of using both the providers that are availible with leaflet I created a new function called plot_route_Mapbox().
Feel free to copy-paste the code below:
library(tidyverse)
library(leaflet)
library(tidygeocoder)
library(osrm)


plot_route_Mapbox<-function(to,
                     from,
                     how="car",
                     colour="black",
                     opacity=1,
                     weight=1,
                     radius=2,
                     label_text=c(to,from),
                     label_position="bottom",
                     provider=providers$CartoDB.PositronNoLabels,
                     font = "Lucida Console",
                     font_weight="bold",
                     font_size= "14px",
                     text_indent="15px",
                     saturation=0,
                     mapBoxTemplate= "//{s}.tile.openstreetmap.org/{z}/{x}/{y}.png"){
  address_single <- tibble(singlelineaddress = c(to,from)) %>%
    geocode(address=singlelineaddress,method = 'arcgis') %>%
  transmute(id = singlelineaddress,
         lon=long,
         lat=lat)

  trip <- osrmRoute(src=address_single[1,2:3] %>% c,
                     dst=address_single[2,2:3] %>% c,
                     returnclass="sf",
                    overview="full",
                    osrm.profile = how )

    m<-leaflet(trip,
               options = leafletOptions(zoomControl = FALSE,
                                        attributionControl=FALSE)) %>%
       fitBounds(lng1 = max(address_single$lon)+0.1,
                 lat1 = max(address_single$lat)+0.1,
                 lng2 = min(address_single$lon)-0.1,
                 lat2 = min(address_single$lat)-0.1) %>%
      addTiles(urlTemplate = mapBoxTemplate) %>%
  addCircleMarkers(lat = address_single$lat,
                   lng = address_single$lon,
                   color = colour,
                   stroke = FALSE,
                   radius = radius,
                   fillOpacity = opacity) %>%
      addPolylines(color = colour,
                   opacity=opacity,
                   weight=weight) %>%
       addLabelOnlyMarkers(address_single$lon,
                           address_single$lat,
                           label =  label_text,
                           labelOptions = labelOptions(noHide = T,
                                                       direction = label_position,
                                                       textOnly = T,
                                                       style=list("font-family" = font,
                                                                  "font-weight"= font_weight,
                                                                  "font-size"=font_size,
                                                                  "text-indent"=text_indent)))

  m
}
Below the code which I used for creating the map. I made this theme styled like the the “Nature Walk” theme on Atlas.co. It is possible to do other themes as well with some playing around on MapBox studio, but for now, this is just proof of concept.
viz<- plot_route_Mapbox("Toronto",
                 "Niagara Falls",
                  how="car",
                  font="Courier",
                  label_position="right",
                  weight=1.5,
                 mapBoxTemplate ="https://api.mapbox.com/styles/v1/benyamindsmith/ckv64zmgy1awy14ofg33zmszz/tiles/{z}/{x}/{y}?access_token=pk.eyJ1IjoiYmVueWFtaW5kc21pdGgiLCJhIjoiY2tiMDR3NXpzMDU3bjJ1cXVqNmx3ODhudyJ9.KffbwvHgcIn1GL1DV4uUBQ")

viz
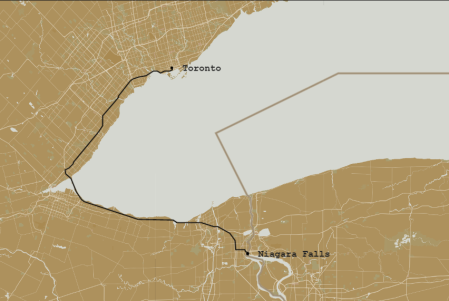
With a little bit of aesthetic edits around with Canva, we can have a poster ready visual!

See my previous blog to see how to save your visual as an .svg that you can print at any size!
Thank you for reading!

Want to see more of my content?
Be sure to subscribe and never miss an update!
R-bloggers.com offers daily e-mail updates about R news and tutorials about learning R and many other topics. Click here if you're looking to post or find an R/data-science job.
Want to share your content on R-bloggers? click here if you have a blog, or here if you don't.