
Ggplot with moving averages
Want to share your content on R-bloggers? click here if you have a blog, or here if you don't.
There is so much to learn in the world of R. One thing that I want to learn more about is working with time series data. I’ve read a lot about the tidyquant package and its uses with time series data so that was top of my list to start learning time series. This post walks through some of my learning tidyquant from this helpful vignette.
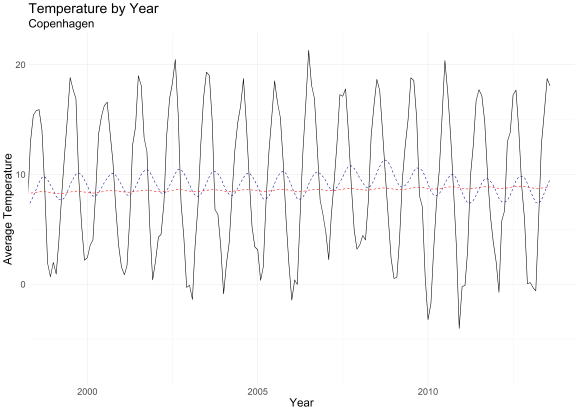
Especially with time series data we may want to show the data at the finest resolution but also overlay the trend averaged over a longer period of time. Here is an example using the Berkeley climate change data (introduced in this post) where we show the temperature in Copenhagen with two smoothing functions overlayed.
To generate the graph we first need to import the data, filter for Copenhage, and format the date column as a date.
df <- read.csv("Data/GlobalLandTemperaturesByCity.csv")
df <- df %>% filter(City == "Copenhagen" & !is.na(AverageTemperature))
df$dt <- as.Date(df$dt)
Once the data is prepared, it’s time to plot! Here we use ggplot2 to make the basic plot. The first few lines of code are similar to any plot that we might make with ggplot2: we call the dataframe, make a ggplot object with x and y variables specified in the aes(), and add geom_line() for a line graph. Then, the interesting, time series part comes up. We call geom_ma() twice to add two different moving averages. We call coord_x_date() to specify the date range. This let’s us select the time frame that we’re interested in which is very helpful if we have a long time series of data but only want to show part of it.
cop_temp <- df %>%
  ggplot(aes(x = dt, y = AverageTemperature)) +
  geom_line() +
  geom_ma(ma_fun = SMA, n = 30) +                 # Plot 30-day SMA
  geom_ma(ma_fun = SMA, n = 365, color = "red") +  # Plot 365-day SMA
  coord_x_date(xlim = c("1999-01-01", "2013-08-01")) + # Zoom in
  labs(x = "Year", y = "Average Temperature", title = "Temperature by Year", subtitle = "Copenhagen") +
  theme_minimal() +
  theme(text = element_text(size = 20))
cop_temp
Using this code chunk we produce a nice plot of the temperature in Copenhagen with the underlying data and moving averages shown.
Tidyquant has 6 types of moving average:
- simple moving averages (SMA)
- exponential moving averages (EMA)
- weighted moving averages (WMA)
- double exponential moving averages (DEMA)
- zero-lag exponential moving averages (ZLEMA)
- volume-weighted moving averages (VWMA)
- elastic, volume-weighted moving averages (EVMA)
Moving averages are applied as an added layer to a chart with the geom_ma function. In this example geom_ma(ma_fun = SMA, n = 30) indicates that the moving average geom should use the SMA function which applies a simple moving average. So a moving window averages the last 30 points. Then we add another geom_ma with a simple moving average but specify n = 365 and plot that in red. So the red line is a moving window average of the last 365 points. You can see that when more points are used for the average it makes a smoother fit and reduces much of the annual variation.
To learn more about the tidyquant package check out this informative vignette.
There you have it! Moving averages with ggplot. I hope that you found this post helpful or at least interesting. Please let me know if you have an R question that you would like explained on here. And thanks for following along with my R journey.
R-bloggers.com offers daily e-mail updates about R news and tutorials about learning R and many other topics. Click here if you're looking to post or find an R/data-science job.
Want to share your content on R-bloggers? click here if you have a blog, or here if you don't.