Advent of 2020, Day 13 – Using Python Databricks Koalas with Azure Databricks
Want to share your content on R-bloggers? click here if you have a blog, or here if you don't.
Series of Azure Databricks posts:
- Dec 01: What is Azure Databricks
- Dec 02: How to get started with Azure Databricks
- Dec 03: Getting to know the workspace and Azure Databricks platform
- Dec 04: Creating your first Azure Databricks cluster
- Dec 05: Understanding Azure Databricks cluster architecture, workers, drivers and jobs
- Dec 06: Importing and storing data to Azure Databricks
- Dec 07: Starting with Databricks notebooks and loading data to DBFS
- Dec 08: Using Databricks CLI and DBFS CLI for file upload
- Dec 09: Connect to Azure Blob storage using Notebooks in Azure Databricks
- Dec 10: Using Azure Databricks Notebooks with SQL for Data engineering tasks
- Dec 11: Using Azure Databricks Notebooks with R Language for data analytics
- Dec 12: Using Azure Databricks Notebooks with Python Language for data analytics
So far, we looked into SQL, R and Python and this post will be about Python Koalas package. A special implementation of pandas DataFrame API on Apache Spark. Data Engineers and data scientist love Python pandas, since it makes data preparation with pandas easier, faster and more productive. And Koalas is a direct “response” to make writing and coding on Spark, easier and more familiar. Also follow the official documentation with full description of the package.
Koalas come pre-installed on Databricks Runtine 7.1 and above and we can use package directly in the Azure Databricks notebook. Let us check the Runtime version. Launch your Azure Databricks environment, go to clusters and there you should see the version:

My cluster is rocking Databricks Runtime 7.3. So create a new notebook and name it: Day13_Py_Koalas and select the Language: Python. And attach the notebook to your cluster.
1.Object Creation
Before going into sample Python code, we must import the following packages: pandas and numpy so we can create from or convert from/to Databricks Koalas.
import databricks.koalas as ks
import pandas as pd
import numpy as np
Creating a Koalas Series by passing a list of values, letting Koalas create a default integer index:
s = ks.Series([1, 3, 5, np.nan, 6, 8])
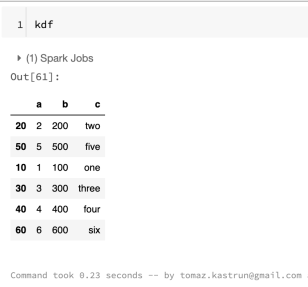
Creating a Koalas DataFrame by passing a dict of objects that can be converted to series-like.
kdf = ks.DataFrame(
    {'a': [1, 2, 3, 4, 5, 6],
     'b': [100, 200, 300, 400, 500, 600],
     'c': ["one", "two", "three", "four", "five", "six"]},
    index=[10, 20, 30, 40, 50, 60])
with the result:

Now, let’s create a pandas DataFrame by passing a numpy array, with a datetime index and labeled columns:
dates = pd.date_range('20200807', periods=6)
pdf = pd.DataFrame(np.random.randn(6, 4), index=dates, columns=list('ABCD'))
and getting the results as pandas dataframe:

Pandas dataframe can easly be converted to Koalas dataframe:
kdf = ks.from_pandas(pdf)
type(kdf)
With type of: Out[67]: databricks.koalas.frame.DataFrame
And we can output the dataframe to get the same result as with pandas dataframe:
kdf

Also, it is possible to create a Koalas DataFrame from Spark DataFrame. We need to load additional pyspark package first, then create a SparkSession and create a Spark Dataframe.
#Load package
from pyspark.sql import SparkSession
spark = SparkSession.builder.getOrCreate()
sdf = spark.createDataFrame(pdf)
Since spark is lazy we need to explicitly call the show function in order to see the spark dataframe.
sdf.show()

Creating Koalas DataFrame from Spark DataFrame. to_koalas() is automatically attached to Spark DataFrame and available as an API when Koalas is imported.
kdf = sdf.to_koalas()

2. Viewing data
See the top rows of the frame. The results may not be the same as pandas though: unlike pandas, the data in a Spark dataframe is not ordered, it has no intrinsic notion of index. When asked for the head of a dataframe, Spark will just take the requested number of rows from a partition.
kdf.head()

You can also display the index, columns, and the underlying numpy data.
kdf.index
kdf.columns
kdf.to_numpy()

And you can also use describe function to get a statistic summary of your data:
kdf.describe()

You can also transpose the data, by adding a T function:
kdf.T
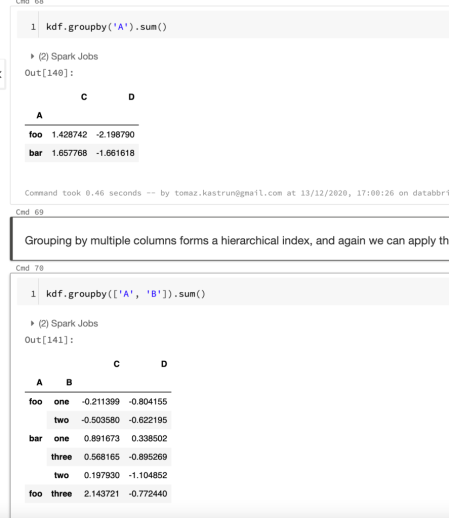
and many other functions. Group is also another great way to get summary of your data. Grouping can be done by “chaining” or adding a group by clause. The internal process – when grouping is applied – happens in three steps:
- Splitting data into groups (base on criteria)
- applying the function and
- combining the results back to data structure.
kdf.groupby('A').sum()
#or
kdf.groupby(['A', 'B']).sum()
Both are grouping data, first time on Column A and second time on both columns A and B:

3. Plotting data
Databricks Koalas is also compatible with matplotlib and inline plotting. We need to load the package:
%matplotlib inline
from matplotlib import pyplot as plt
And can continue by creating a simple pandas series:
pser = pd.Series(np.random.randn(1000),
                 index=pd.date_range('1/1/2000', periods=1000))
that can be simply converted to Koalas series:
kser = ks.Series(pser)
After we have a series in Koalas, we can create cumulative sum of values using series and plot it:
kser = kser.cummax()
kser.plot()

And many other variations of plot. You can also load the seaborn package, boket package and many others.
This blogpost is shorter version of a larger “Koalas in 10 minutes” notebook, and is available in the same Azure Databricks repository as all the samples from this Blogpost series. Notebook briefly touches also data conversion to/from CSV, Parquet (*.parquet data format) and Spark IO (*.orc data format). All will be persistent and visible on DBFS.
Tomorrow we will explore the Databricks jobs, from configuration to execution and troubleshooting., so stay tuned.
Complete set of code and Notebooks will be available at the Github repository.
Happy Coding and Stay Healthy!
R-bloggers.com offers daily e-mail updates about R news and tutorials about learning R and many other topics. Click here if you're looking to post or find an R/data-science job.
Want to share your content on R-bloggers? click here if you have a blog, or here if you don't.

