
Probabilities for action and resistance in Blades in the Dark
Want to share your content on R-bloggers? click here if you have a blog, or here if you don't.
Later this week, I’m going to be GM-ing my first session of Blades in the Dark, a role-playing game designed by John Harper. We’ve already assembled a crew of scoundrels in Session 0 and set the first score. Unlike most of the other games I’ve run, I’ve never played Blades in the Dark, I’ve only seen it on YouTube (my fave so far is Jared Logan’s Steam of Blood x Glass Cannon play Blades in the Dark!).
Action roll
In Blades, when a player attempts an action, they roll a number of six-sided dice and take the highest result. The number of dice rolled is equal to their action rating (a number between 0 and 4 inclusive) plus modifiers (0 to 2 dice). The details aren’t important for the probability calculations. If the total of the action rating and modifiers is 0 dice, the player rolls two dice and takes the worst. This is sort of like disadvantage and (super-)advantage in Dungeons & Dragons 5e.
A result of 1-3 is a failure with a consequence, a result of 4-5 is a success with a consequence, and a result of 6 is an unmitigated success without a consequence. If there are more than two 6s in the result, it’s a success with a benefit (aka a “critical” success).
The GM doesn’t roll. In a combat situation, you can think of the player roll encapsulating a turn of the player attacking and the opponent(s) counter-attacking. On a result of 4-6, the player hits, on a roll of 1-5, the opponent hits back or the situation becomes more desperate in some other way like the character being disarmed or losing their footing. On a critical result (two or more 6s in the roll), the player succeeds with a benefit, perhaps cornering the opponent away from their flunkies.
Resistance roll
When a player suffers a consequence, they can resist it. To do so, they gather a pool of dice for the resistance roll and spend an amount of stress equal to six minus the highest result. Again, unless they have zero dice in the pool, in which case they can roll two dice and take the worst. If the player rolls a 6, the character takes no stress. If they roll a 1, the character takes 5 stress (which would very likely take them out of the action). If the player has multiple dice and rolls two or more 6s, they actually reduce 1 stress.
For resistance rolls, the value between 1 and 6 matters, not just whether it’s in 1-3, in 4-5, equal to 6, or if there are two 6s.
Probabilities
Resistance rolls are rank statistics for pools of six-sided dice. Action rolls just group those. Plus a little sugar on top for criticals. We could do this the hard way (combinatorics) or we could do this the easy way. That decision was easy.
Here’s a plot of the results for action rolls, with dice pool size on the x-axis and line plots of results 1-3 (fail plus a complication), 4-5 (succeed with complication), 6 (succeed) and 66 (critical success with benefit). This is based on 10m simulations.
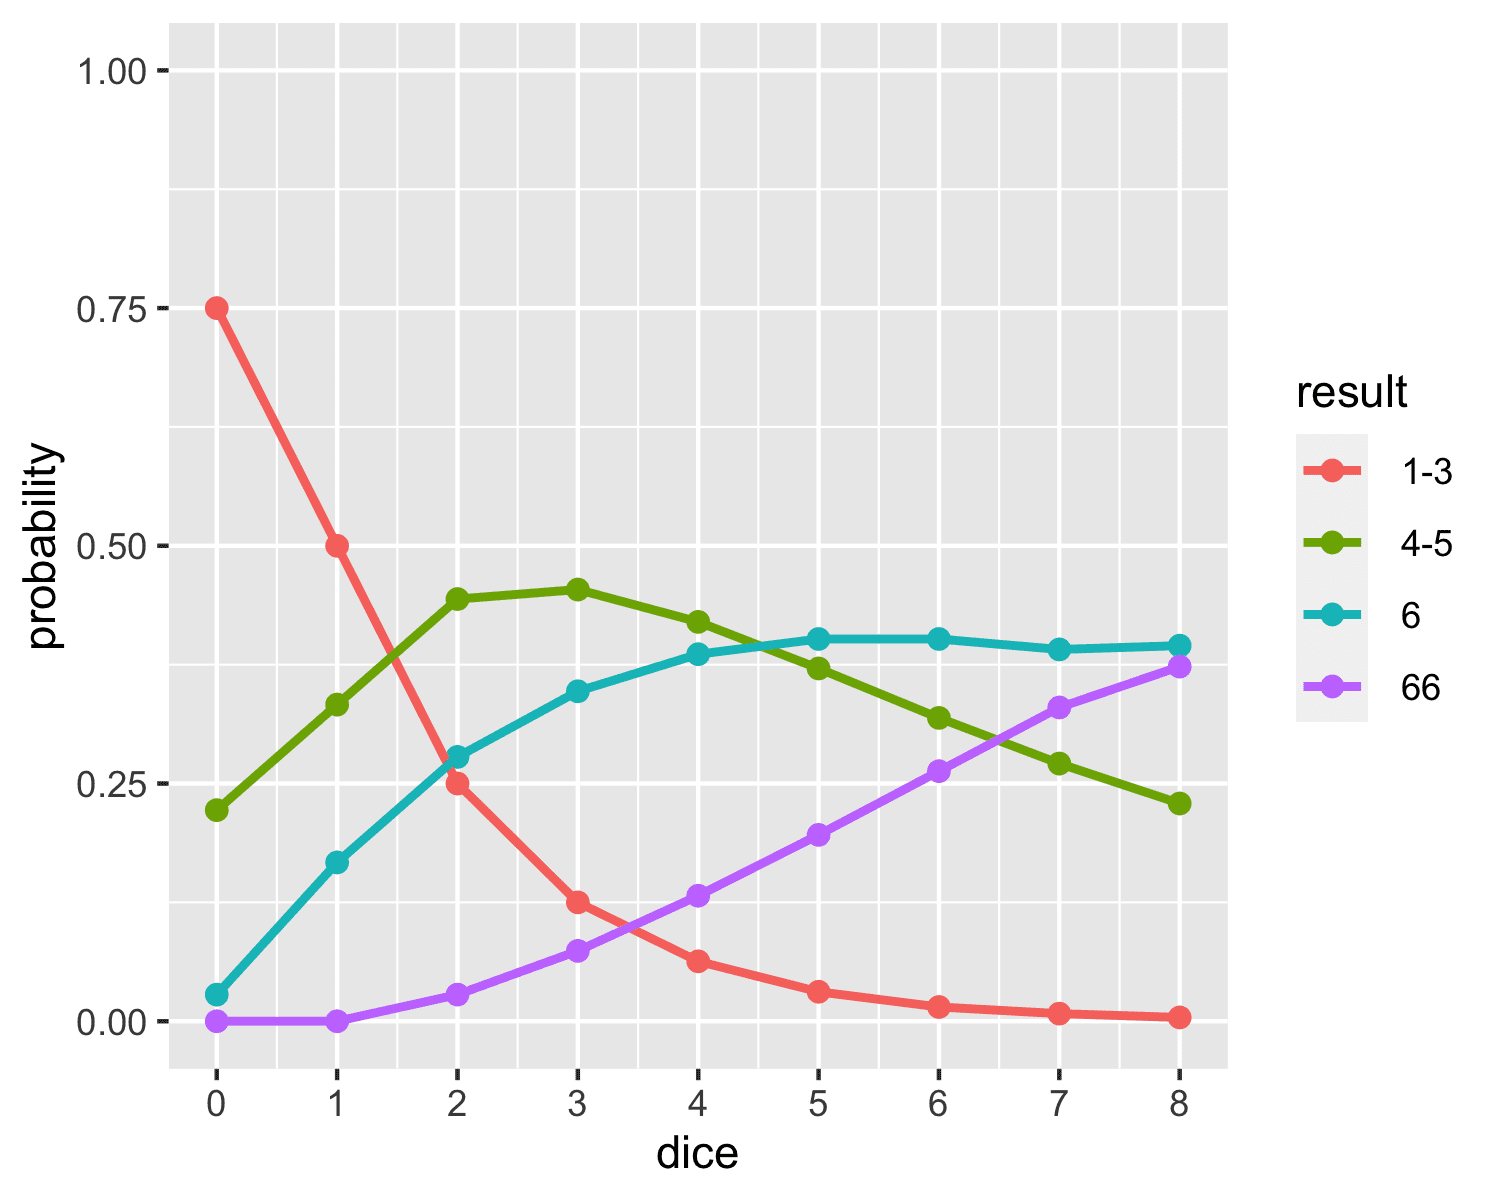
You can find a similar plot from Jasper Flick on AnyDice, in the short note Blades in the Dark.
I find the graph pretty hard to scan, so here’s a table in ASCII format, which also includes the resistance roll probabilities. The 66 result (at least two 6 rolls in the dice pool) is a possibility for both a resistance roll and an action roll. Both decimal places should be correct given the 10M simulations.
DICE   RESISTANCE                      ACTION           BOTH

DICE    1    2    3    4    5    6     1-3  4-5    6      66
----  ----------------------------     -------------    ----
 0d   .36  .25  .19  .14  .08  .03     .75  .22  .03     .00

 1d   .17  .17  .17  .17  .17  .17     .50  .33  .17     .00
 2d   .03  .08  .14  .19  .25  .28     .25  .44  .28     .03

 3d   .01  .03  .09  .17  .29  .35     .13  .45  .35     .07
 4d   .00  .01  .05  .14  .29  .39     .06  .42  .39     .13

 5d   .00  .00  .03  .10  .27  .40     .03  .37  .40     .20
 6d   .00  .00  .01  .07  .25  .40     .02  .32  .40     .26

 7d   .00  .00  .01  .05  .22  .39     .01  .27  .39     .33
 8d   .00  .00  .00  .03  .19  .38     .00  .23  .38     .39
One could go for more precision with more simulations, or resort to working them all out combinatorially.
The hard way
The hard way is a bunch of combinatorics. These aren’t too bad because of the way the dice are organized. For the highest value of throwing N dice, the probability that a value is less than or equal to k is one minus the probability that a single die is greater than k raised to the N-th power. It’s just that there are a lot of cells in the table. And then the differences would be required. Too error prone for me. Criticals can be handled Sherlock Holmes style by subtracting the probability of a non-critical from one. A non-critical either has no sixes (5^N possibilities with N dice) or exactly one six ((6 choose 1) * 5^(N – 1)). That’s not so bad. But there are a lot of entries in the table. So let’s just simulate.
R-bloggers.com offers daily e-mail updates about R news and tutorials about learning R and many other topics. Click here if you're looking to post or find an R/data-science job.
Want to share your content on R-bloggers? click here if you have a blog, or here if you don't.