
Uniquely Merge Fasta Files – Tidy Plots
Want to share your content on R-bloggers? click here if you have a blog, or here if you don't.
One of the best ways to compare the characteristics of any data set is to create descriptive plots. The following R scripts have been improved to generate plots of sequence, line, and size statistics for a set of input fasta files.
The example outputs have been generated from these scripts using test fasta files, and the input option of Sequence to uniquely merged the files.

Driver Script – fastaStats_driver.sh
In order to improve readability, the driver script takes advantage of running independent sequences of code as separate scripts.
As a first step, simple user input errors are handled by checking the input arguments to the driver script for a minimum of merge option and two files. Supported options for uniquely merging fasta files are by sequence, name of sequence, or both sequence and name.
#Check for input arguments of fasta files
if [ $# -lt 3 ]; then
   	echo "Not enough fasta files input... exiting!"
   	exit 1
fi

#Store list of input fasta file paths after
# skipping the first input argument of mergeBy
for i in "${@:2}"; do
    fastaList="$fastaList$i "
done
The input file paths are then compiled into a list and input to the fastaMerge.sh bash script for merging. The resulting merged fasta file is then input to the next fastaStats.sh and fastaStats_csvFormatted.sh bash scripts for calculating file statistics. Finally, the fasta file statistics are plotted with the fastaStats_barPlot.r R script and output as jpg image files.
#Set output file paths
outputFastaFile="./merged"$1"_Trinity.fasta"
summaryFile="./merged"$1"Fasta_summary.txt"

#Merge the set of fasta files
echo "Beginning fasta file merging..."
bash fastaMerge.sh $1 $outputFastaFile $fastaList

#Write fasta stats to the summary file
echo "Beginning file statistics summarizing..."
bash fastaStats.sh $fastaList $outputFastaFile > $summaryFile

#Write fasta stats to the csv formatted summary file
echo "Beginning file statistics formatting..."
summaryFileCSV=$(echo "$summaryFile" | sed 's/\.txt/\.csv/g')
bash fastaStats_csvFormatted.sh $fastaList $outputFastaFile > $summaryFileCSV

#Plot fasta stats from summary file
echo "Beginning file statistics plotting..."
Rscript fastaStats_barPlots.r $1 $summaryFileCSV
Merging Script – fastaMerge.sh
The merging script combines a number of input fasta files while retaining only the sequences that are unique by the specified criteria. The options for uniquely merging fasta files are by sequence, name of sequence, or both sequence and name.
#Determine which method to merge fasta files by
if [[ "$1" == *equence ]]; then
	#Sequence identical merge
	awk 'BEGIN{RS=">"; FS="\n"; ORS=""}
		(FNR==1){next}
		{ name=$1; seq=$0; gsub(/(^[^\n]*|)\n/,"",seq) }
		!(seen[seq]++){ print ">" $0 }' $fastaList > $2
elif [[ "$1" == *ame ]]; then
	#First part of sequence name identical merge
	awk 'BEGIN{RS=">"; FS="\n"; ORS=""}
		(FNR==1){next}
		{ name=$1; seq=$0; gsub(/(^[^\n]*|)\n/,"",seq) }
		{ key=substr(name,1,index(s,"|")) }
		!(seen[key]++){ print ">" $0 }' $fastaList > $2
elif [[ "$1" == *equenceAndName || *equence*ame ]]; then
	#Sequence name and sequence identical merge
	awk 'BEGIN{RS=">"; FS="\n"; ORS=""}
		(FNR==1){next}
		{ name=$1; seq=$0; gsub(/(^[^\n]*|)\n/,"",seq) }
		!(seen[name,seq]++){ print ">" $0 }' $fastaList > $2
else
	echo "Selected merge format for fasta files not valid... exiting!"
	exit 1
fi
Basic Stats Script – fastaStats.sh
The fastaStats.sh script outputs the characteristics of the input fasta files in a readable format, and includes calculations of file statistics for the list of input fasta files.
The input list of files are assigned tags based on file number. These tags are used later to create tidy plots in R.
#Output file list with tags
printf "File list:\n"
for i in "$@"; do
	echo "file$counter $i"
	#Increment counter
	counter=$(($counter+1))
done
Next, the number of sequences is calculated for each file. A running total of file statistics for each input fasta file is also calculated for comparison with the merged file stats.
#Check number of sequences
printf "\nNumber of sequences:\n"
for i in "$@"; do
	#Calculate current file stats
	seqs=$(grep ">" $i | wc -l); echo "$seqs $i"
	#Calculate running total of un-merged file stats
	if [[ $counter -lt $# ]]; then
		seqsTotal=$(($seqsTotal+$seqs))
	fi
	#Increment counter
	counter=$(($counter+1))
done
echo "$seqsTotal un-merged file total"
Similarly, the number of lines are determined for each file for comparing with sequence numbers.
#Check number of lines
printf "\nNumber of lines:\n"
for i in "$@"; do
	#Calculate current file stats
	lines=$(wc -l $i | awk '{print $1}'); echo "$lines $i"
	#Calculate running total of un-merged file stats
	if [[ $counter -lt $# ]]; then
		linesTotal=$(($linesTotal+$lines))
	fi
	#Increment counter
	counter=$(($counter+1))
done
echo "$linesTotal un-merged file total"
Finally, the MB size of each file is calculated.
#Check file sizes
printf "\nFile sizes (MB):\n"
for i in "$@"; do
	#Calculate current file stats
	mBytes=$(ls -l --block-size=1MB $i | cut -d " " -f5); echo "$mBytes $i"
	#Calculate running total of un-merged file stats
	if [[ $counter -lt $# ]]; then
		mBytesTotal=$(($mBytesTotal+$mBytes))
	fi
	#Increment counter
	counter=$(($counter+1))
done
echo "$mBytesTotal un-merged file total"
Example Output – mergedSequenceFasta_summary.txt
File list:
file1 /run1_assemblyTrinity_mergedFasta/Trinity.fasta
file2 /run1_assemblyGenomeTrinity_mergedFasta/Trinity.fasta
file3 /run2_assemblyGenomeTrinity_mergedFasta/Trinity.fasta
file4 ./mergedSequence_Trinity.fasta
Number of sequences:
564869 /run1_assemblyTrinity_mergedFasta/Trinity.fasta
383484 /run1_assemblyGenomeTrinity_mergedFasta/Trinity.fasta
317055 /run2_assemblyGenomeTrinity_mergedFasta/Trinity.fasta
1211283 ./mergedSequence_Trinity.fasta
1265408 un-merged file total
Number of lines:
1129738 /run1_assemblyTrinity_mergedFasta/Trinity.fasta
766968 /run1_assemblyGenomeTrinity_mergedFasta/Trinity.fasta
634110 /run2_assemblyGenomeTrinity_mergedFasta/Trinity.fasta
2422566 ./mergedSequence_Trinity.fasta
2530816 un-merged file total
File sizes (MB):
1125 /run1_assemblyTrinity_mergedFasta/Trinity.fasta
595 /run1_assemblyGenomeTrinity_mergedFasta/Trinity.fasta
284 /run2_assemblyGenomeTrinity_mergedFasta/Trinity.fasta
1949 ./mergedSequence_Trinity.fasta
2004 un-merged file total
Stats Formatting Script – fastaStats_csvFormatted.sh
This formatting script is used to make plotting in R easier later. The characteristics of the input fasta files are output in csv format, and includes calculations of file statistics for the list of input fasta files.
#Create header for csv
echo "file,sequences,lines,MB"

#Loop over input files and retrieve stats
for i; do
	#Calculate current file stats
	seqs=$(grep ">" $i | wc -l)
	lines=$(wc -l $i | cut -d " " -f1)
	mBytes=$(ls -l --block-size=1MB $i | cut -d " " -f5)
	#Output file name tags and stats
	echo "file$counter,$seqs,$lines,$mBytes"

	#Calculate running total of un-merged file stats
	if [[ $counter -lt $# ]]; then
		seqsTotal=$(($seqsTotal+$seqs))
		linesTotal=$(($linesTotal+$lines))
		mBytesTotal=$(($mBytesTotal+$mBytes))
	fi
	#Increment counter
	counter=$(($counter+1))
done

#Output total stats
echo "total,$seqsTotal,$linesTotal,$mBytesTotal"
Example Output – mergedSequenceFasta_summary.csv
file,sequences,lines,MB
file1,564869,1129738,1125
file2,383484,766968,595
file3,317055,634110,284
file4,1211283,2422566,1949
total,1265408,2530816,2004
Plotting Script – fastaStats_barPlots.r
The following R script uses the tidyverse and ggpubr packages to create tidy plots of the fasta file statistics. These packages need to be installed in advance of running the scrip, then loaded each time the script is run.
#Installations need to be performed once
#The easiest way to get ggplot2 is to install the whole tidyverse
install.packages("tidyverse")
install.packages("ggpubr")

#Import librarys
library(ggplot2)
library(ggpubr)
First, user inputs are checked for the required arguments of a plot title and csv file. Next, data from the input csv file is loaded into an R data frame, statsMerged. The subset of the input data that does not contain the merged or total file statistics are loaded into a separate data frame, statsFiles.
#Retrieve input arguments
args=commandArgs(trailingOnly=TRUE)
numArgs=length(args)
#Test if there is one input argument
if (numArgs!=2) {
  stop("A file name and plot title must be supplied.n", call.=FALSE)
}

#Retrieve file stats
aStats <- read.csv(file=args[2])
totalIndex <- length(rownames(aStats))
endFiles <- totalIndex-2

#Create data frame of combined file stats
statsMerged <- data.frame(aStats$file, aStats$sequences, aStats$lines, aStats$MB)
statsFiles <- statsMerged[1:endFiles,]
The plot titles are now set using the first input argument.
#Set the plot titles and output file
plotTitle1 <- args[1]
plotTitle2 <- "File Stats"
plotTitle <- paste(plotTitle1, plotTitle2, sep=" ")
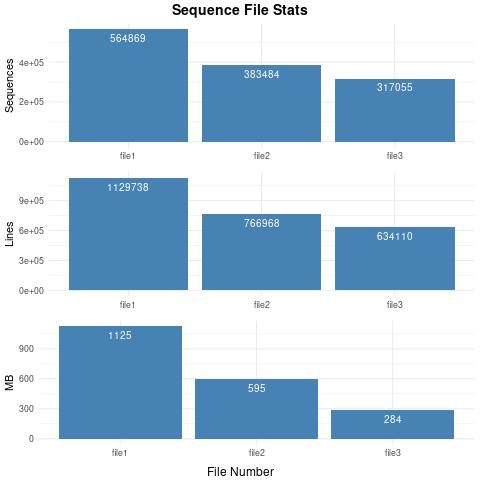
This script is a bit large since it is plotting two sets of statistics at once, the input file statistics with and without the merged file data. It is convenient to plot both sets of statistics for better resolution of the input fasta file characteristics.
First generated are plots of the number of sequences of each input fasta file, in addition to the merged and total file sequence numbers.
#Generate sequences bar plots
plotSeqsMerged <- ggplot(statsMerged, aes(x=aStats.file, y=aStats.sequences)) +
  geom_bar(stat="identity", fill="steelblue") +
  theme_minimal() +
  geom_text(aes(label=aStats.sequences), vjust=1.6, color="white", size=3.5) +
  ylab("Sequences") +
  theme(axis.title.x = element_blank())
plotSeqsFiles <- ggplot(statsFiles, aes(x=aStats.file, y=aStats.sequences)) +
  geom_bar(stat="identity", fill="steelblue") +
  theme_minimal() +
  geom_text(aes(label=aStats.sequences), vjust=1.6, color="white", size=3.5) +
  ylab("Sequences") +
  theme(axis.title.x = element_blank())
Next, the number of lines for each set of files are plotted.
#Generate lines bar plots
plotLinesMerged <- ggplot(statsMerged, aes(x=aStats.file, y=aStats.lines)) +
  geom_bar(stat="identity", fill="steelblue") +
  theme_minimal() +
  geom_text(aes(label=aStats.lines), vjust=1.6, color="white", size=3.5) +
  ylab("Lines") +
  theme(axis.title.x = element_blank())
plotLinesFiles <- ggplot(statsFiles, aes(x=aStats.file, y=aStats.lines)) +
  geom_bar(stat="identity", fill="steelblue") +
  theme_minimal() +
  geom_text(aes(label=aStats.lines), vjust=1.6, color="white", size=3.5) +
  ylab("Lines") +
  theme(axis.title.x = element_blank())
Finally, the MB size of each set of files.
#Generate MB bar plots
plotMBMerged <- ggplot(statsMerged, aes(x=aStats.file, y=aStats.MB)) +
  geom_bar(stat="identity", fill="steelblue")+
  theme_minimal() +
  geom_text(aes(label=aStats.MB), vjust=1.6, color="white", size=3.5) +
  ylab("MB") +
  theme(axis.title.x = element_blank())
plotMBFiles <- ggplot(statsFiles, aes(x=aStats.file, y=aStats.MB)) +
  geom_bar(stat="identity", fill="steelblue")+
  theme_minimal() +
  geom_text(aes(label=aStats.MB), vjust=1.6, color="white", size=3.5) +
  ylab("MB") +
  theme(axis.title.x = element_blank())
The plots are then arranged into sets using the ggarrange function from the ggpubr library. The annotate_figure function was used to generate a single title and x-axis label for each set of plots. The first set of plots is includes the merged and total file statistics, while the second set of plots includes only the stats for the original input list of fasta files.
#Arrange stats plots on grid
finalMergedPlot <- ggarrange(plotSeqsMerged, plotLinesMerged, plotMBMerged, nrow=3)
finalFilesPlot <- ggarrange(plotSeqsFiles, plotLinesFiles, plotMBFiles, nrow=3)
#Add plot title and x-axis label
finalMergedPlot <- annotate_figure(finalMergedPlot,
  top=text_grob(plotTitle, color="black", face="bold", size=14),
  bottom=text_grob("File Number", color="black", size=12))
finalFilesPlot <- annotate_figure(finalFilesPlot,
  top=text_grob(plotTitle, color="black", face="bold", size=14),
  bottom=text_grob("File Number", color="black", size=12))
Finally, the two sets of plots are saved to jpg files using the ggexport function. The input title was used to create output file names for the plots.
#Set output file names
plotMergedOut <- "mergedStats.jpg"
plotFilesOut <- "fileStats.jpg"
plotMergedFile <- paste(plotTitle1, plotMergedOut, sep="_")
plotFilesFile <- paste(plotTitle1, plotFilesOut, sep="_")
#Set output path to the input file path
outMergedFile <- paste(normalizePath(dirname(args[2])), plotMergedFile, sep="/")
outFilesFile <- paste(normalizePath(dirname(args[2])), plotFilesFile, sep="/")

#Save file stats plots as a jpg
ggexport(finalMergedPlot, filename=outMergedFile)
ggexport(finalFilesPlot, filename=outFilesFile)
Example First Output – Sequence_mergedStats.jpg
Example Second Output – Sequence_fileStats.jpg
R-bloggers.com offers daily e-mail updates about R news and tutorials about learning R and many other topics. Click here if you're looking to post or find an R/data-science job.
Want to share your content on R-bloggers? click here if you have a blog, or here if you don't.