
Cricket Moneyball?
Want to share your content on R-bloggers? click here if you have a blog, or here if you don't.
Moneyball. That horrific word coined by the book written by Michael Lewis and later hammered further into the public consciousness with the film starring Brad Pitt. Now anything in sport using stats is termed Moneyball when the truth couldn’t be further from that. In this blog I am going to look at some concepts of moneyball.
The background behind this is I have been reviewing the math behind Moneyball course on Coursera. The course linked here:
https://www.coursera.org/learn/mathematics-sport
The problem is most of the course is based in excel and in the modern world I like to use code to analyse data and R in particular. Also this is also based mostly on baseball and as not a particularly big baseball fan, i am going to apply it to cricket
Pythagorean Theorem
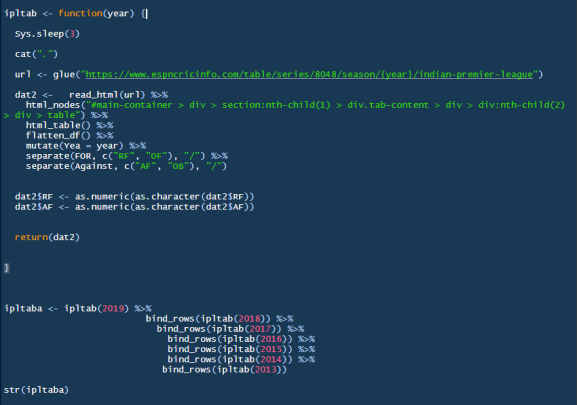
The first concept it looks at is the Pythagorean theorem. Its slightly different to the one you probably remember from school which looked at sides of a triangle. This was created by Bill James for baseball and it looks at the number of runs conceded and scored to get the win percentage. Applying it to cricket i’m going to focus on the IPL. A key part of the formula to calculate the win percentage is the exponent. This is a constant and for baseball it is 2. However, there is no great literature for cricket. I have found one blog that quotes it at the 8 however lets compute it myself and see what it comes out with.

Based on this data the best value for the exponent in the IPL looks to be around 10 or 11. This is different to the previous work I found. If we apply this to every team since the 2013 season I can compare there actual win percentage against the actual win percentage
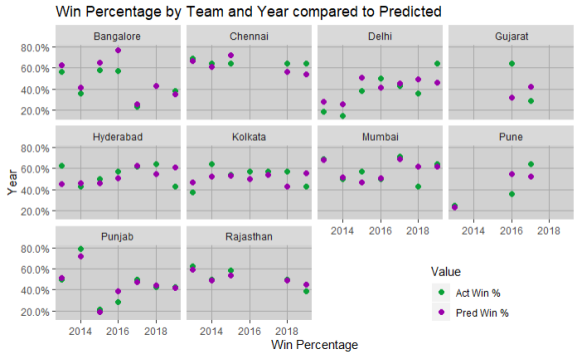
Some interesting trends are visible here. If you look at Sunrisers Hyderabad they have gradually increased their predicted win percentage since 2013. Is this smarter recruitment? They also massively under performed the predicted win percentage in 2019 therefore is there a chance of a regression to the mean in 2020?. Chennai seem to have over performed the last 2 years and seem to have a general trend downwards in predicted win percentage. The next thing that can be done with this is calculate how many extra runs you need to win one extra twenty20 game.

Above I create a data frame with runs for increasing in 5 from 2225 which is the average total runs a team scores in an IPL league season to 2285.
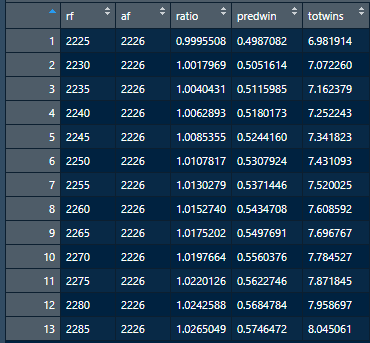
The summary table of the output shows that scoring an extra 60 runs over the season is the equivalent of one extra win. Therefore you need to recruit the players to achieve that extra 60 runs. That can also be bowlers as if you reduce the opposition to 30 less runs you only need to score 30 more runs. That is going to be the subject of the next blog.
R-bloggers.com offers daily e-mail updates about R news and tutorials about learning R and many other topics. Click here if you're looking to post or find an R/data-science job.
Want to share your content on R-bloggers? click here if you have a blog, or here if you don't.