
Partial Dependence Plot (PDP) of GRNN
Want to share your content on R-bloggers? click here if you have a blog, or here if you don't.
The function grnn.margin() (https://github.com/statcompute/yager/blob/master/code/grnn.margin.R) was my first attempt to explore the relationship between each predictor and the response in a General Regression Neural Network, which usually is considered the Black-Box model. The idea is described below:
- First trained a GRNN with the original training dataset
- Created an artificial dataset from the training data by keeping distinct values of the variable that we are interested in but replacing all values of other variables with their means. For instance, given a dataset with three variables X1, X2, and X3, if we are interested in the marginal effect of X1 with 3 distinct values, e.g. [X11 X12 X13], then the constructed dataset should look like {[X11 mean(X2) mean(X3)], [X12 mean(X2) mean(X3)], [X13 mean(X2) mean(X3)]}
- Calculated predicted values, namely [Pred1 Pred2 Pred3], based on the constructed dataset by using the GRNN created in the first step
- At last, the relationship between [X11 X12 X13] and [Pred1 Pred2 Pred3] is what we are looking for
The above-mentioned approach is computationally efficient but might be somewhat “brutal” in a sense that it doesn’t consider the variation in other variables.
By the end of Friday, my boss pointed me to a paper describing the partial dependence plot (Yes! In 53, we also have SVP who is technically savvy). The idea is very intriguing, albeit computationally expensive, and is delineated as below:
- First trained a GRNN with the original training dataset
- Based on the training dataset, get a list of distinct values from the variable of interest, e.g. [X11 X12 X13]. In this particular example, we created three separate datasets from the training data by keeping the other variables as they are but replacing all values of X1 with each of [X11 X12 X13] respectively
- With each of three constructed datasets above, calculated predicted values and then averaged them out such that we would have an average of predicted values for each of [X11 X12 X13], namely [Pavg1 Pavg2 Pavg3]
- The relationship between [X11 X12 X13] and [Pavg1 Pavg2 Pavg3] is the so-called Partial Dependence
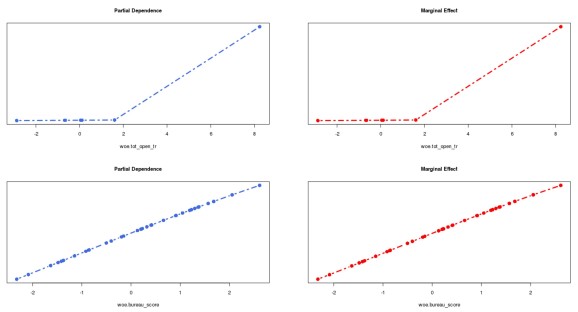
The idea of PDP has been embedded in the YAGeR project (https://github.com/statcompute/yager/blob/master/code/grnn.partial.R). In the chart below, I compared outcomes of grnn.partial() and grnn.margin() side by side for two variables, e.g. the first not so predictive and the second very predictive. In this particular comparison, both appeared almost identical.
R-bloggers.com offers daily e-mail updates about R news and tutorials about learning R and many other topics. Click here if you're looking to post or find an R/data-science job.
Want to share your content on R-bloggers? click here if you have a blog, or here if you don't.