
Predicting Qualifying — 2
Want to share your content on R-bloggers? click here if you have a blog, or here if you don't.
In the last blog I outlined creating a model which predicts the fastest time for each driver in F1 qualifying.
theparttimeanalyst.com/2019/07/10/predicting-f1-qualifying/
Today I am going to be dissecting the model to understands its strengths and weaknesses and to look if their is any bias within the model. First lets look at the importance matrix


The most important variable is the fastest time produced in practice 2. This is no surprise. Often the plan that all teams follow is to prepare for qualifying in practice 2 therefore for predicting qualifying they were always going to be important variables. Also its not surprising track length is important as that will always be a key driver for the final lap-time.

Looking at the RMSE by there’s a few races where the model has been really accurate however there are others where it has struggled. The worst of them is the British Grand Prix which has the worst RMSE. I think that’s because some of the training data has got some wet sessions in. This is one area the model doesn’t have and therefore could be a source of errors. Wet running would have an effect on lap times. Other then that most other races are predicted pretty well.
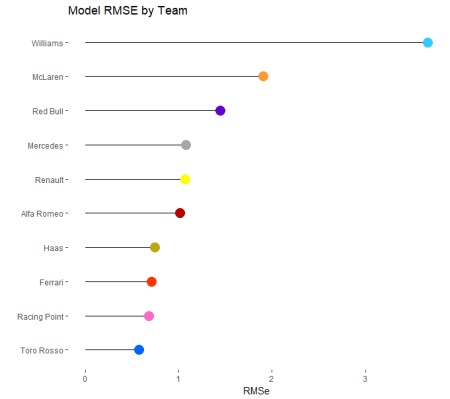
RMSE by team shows some differences across the grid. With Williams being particularly off compared to the other teams. Lets look to see if its mostly worn in a particular direction for Williams.
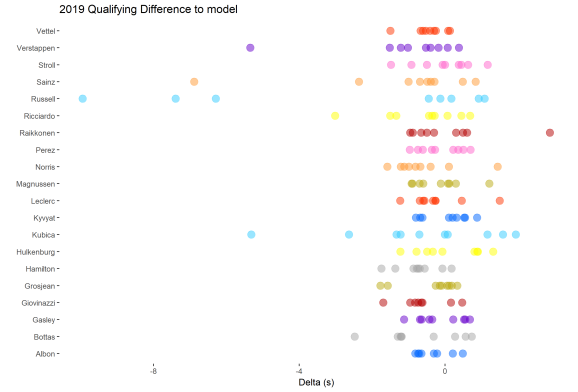
When I plot each race weekend for each driver’s difference from the calculated qualifying time to the actual qualifying time I can see that most of the time the model under estimates the drivers final qualifying time. Most races the prediction is within half a second. There are a few outliers, mainly Williams, which is probably the reason Williams have the highest RMSE. I have had a look at the model with real data lets try and understand it further by putting fake data into it and seeing what results you get. The first thing to do look at the effect of team. I provided the model with data where the only differentiation is the team.

So with all cars having the same data apart from the team Renault comes out as the fastest team with Mclaren a lot slower then everyone else. I wonder if this is because historically Mclaren over performed in practice 2 and often went backwards as the weekend went on.
Ultimately this models judgement comes when compared to another type of model with the same data. Therefore to do that I have created a bayesian generalised linear model and I will compare that to the machine learning xgboost model. All the code for this model can befound on my GitHub.
R-bloggers.com offers daily e-mail updates about R news and tutorials about learning R and many other topics. Click here if you're looking to post or find an R/data-science job.
Want to share your content on R-bloggers? click here if you have a blog, or here if you don't.