
Plot shared favourability for two competing species
Want to share your content on R-bloggers? click here if you have a blog, or here if you don't.
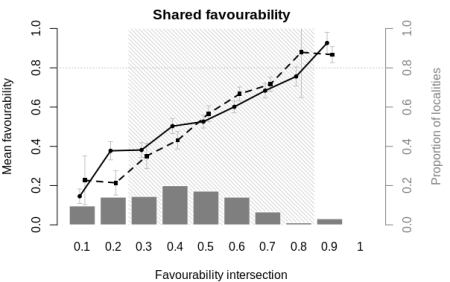
The sharedFav function below implements the graphical analyses of Acevedo et al. (2010, 2012) on biogeographical interactions. It takes two vectors of favourability values at different localities for, respectively, a stronger and a weaker competing species (or two equally strong competitors), and plots their favourableness or shared favourability to assess potential competitive interactions.
sharedFav <- function(strong_F, weak_F, conf = 0.95, main = "Shared favourability") {

stopifnot(length(strong_F) == length(weak_F))

opar <- par(no.readonly = T)

par(mar = c(4, 4, 2, 4.5))

F_intersection <- fuzzyOverlay(cbind(strong_F, weak_F), op = "intersection")

F_union <- fuzzyOverlay(cbind(strong_F, weak_F), op = "union")

Fovl <- sum(F_intersection, na.rm = TRUE) / sum(F_union, na.rm = TRUE)

brks <- seq(0, 1, by = 0.1)

bins <- 1:10

bin <- cut(F_intersection, breaks = brks, labels = bins)

strong_mean <- tapply(strong_F, INDEX = bin, FUN = mean)

weak_mean <- tapply(weak_F, INDEX = bin, FUN = mean)

strong_ci <- tapply(strong_F, INDEX = bin, FUN = function(x) t.test(x, conf.level = conf, na.action = na.pass)$conf.int)

weak_ci <- tapply(weak_F, INDEX = bin, FUN = function(x) t.test(x, conf.level = conf)$conf.int)

strong_ci[names(Filter(is.null, strong_ci))] <- NA

weak_ci[names(Filter(is.null, weak_ci))] <- NA

strong_ci_up <- unlist(lapply(strong_ci, `[`, 2))

strong_ci_dn <- unlist(lapply(strong_ci, `[`, 1))

weak_ci_up <- unlist(lapply(weak_ci, `[`, 2))

weak_ci_dn <- unlist(lapply(weak_ci, `[`, 1))

bin_size <- table(bin)

names(bin_size) <- names(bins)

props <- bin_size / length(bin)

bin <- as.integer(bin)

bar_plot <- barplot(rep(NA, length(bins)), ylim = c(0, 1), xlab = "Favourability intersection", ylab = "Mean favourability", names.arg = brks[-1], main = main)

col_bar <- "grey50"

col_ci <- "grey"

poly_left <- mean(bar_plot[2:3])

poly_right <- mean(bar_plot[8:9])

polygon(x = c(poly_left, poly_left, poly_right, poly_right), y = c(0, 1, 1, 0), col = "lightgrey", border = NA, density = 25, angle = -45)

par(new = TRUE)

barplot(props, col = col_bar, border = FALSE, xaxt = "n", yaxt = "n", add = TRUE)

axis(side = 4, col = col_bar, col.axis = col_bar, col.ticks = col_bar, col.lab = col_bar)

mtext(side = 4, line = 3, "Proportion of localities", col = col_bar)

abline(h = 0.8, col = "grey", lty = 3)

strong_x <- bar_plot - 0.1

weak_x <- bar_plot + 0.1

arrows(strong_x, strong_ci_dn, strong_x, strong_ci_up, code = 3, length = 0.03, angle = 90, col = col_ci)

arrows(weak_x, weak_ci_dn, weak_x, weak_ci_up, code = 3, length = 0.03, angle = 90, col = col_ci)

lines(x = strong_x, y = strong_mean, lwd = 2, lty = 1)

lines(x = weak_x, y = weak_mean, lwd = 2, lty = 2)

points(x = strong_x, y = strong_mean, pch = 20)

points(x = weak_x, y = weak_mean, pch = 15, cex = 0.8)

par(opar)

return(Fovl)

}
The function returns the fuzzy overlap index and a shared favourability plot similar to those of Acevedo et al. (2010, 2012). For more details, examples of use and additional references, see the help files of these functions in package fuzzySim >= 2.2, currently available on R-Forge. Special thanks to Pelayo Acevedo and Darío Chamorro for clarifications on how to build the plot!
References
Acevedo P., Ward A.I., Real R. & Smith G.C. (2010) Assessing biogeographical relationships of ecologically related species using favourability functions: a case study on British deer. Diversity and Distributions, 16: 515-528
Acevedo P., Jiménez-Valverde A., Melo-Ferreira J., Real R. & Alves, P.C. (2012) Parapatric species and the implications for climate change studies: a case study on hares in Europe. Global Change Biology, 18: 1509-1519
Richerson P.J. & Lum K. (1980) Patterns of plant species and diversity in California: relation to weather and topography. American Naturalist 116: 504-536
R-bloggers.com offers daily e-mail updates about R news and tutorials about learning R and many other topics. Click here if you're looking to post or find an R/data-science job.
Want to share your content on R-bloggers? click here if you have a blog, or here if you don't.