ELK+R Stack
Want to share your content on R-bloggers? click here if you have a blog, or here if you don't.
Elasticsearch is a search engine based on the Lucene library. It provides a distributed full-text search engine with an HTTP web interface and schema-free JSON documents.
Elasticsearch is becoming the bigger player in the technology for documents search in the noSQL space and is actually experiencing a great development phase (6 versions in few years and an exponentially growth of the community).
I have installed elasticsearch version 6.5.4 and kibana (aligned version 6.5.4) on my Mac where I have installed R software version 3.5.
First impact: I have worked few hours in trying to have everything fine installed on my machine. In order to work with such technologies a limited set of hacking skills are required.
For installing both elasticsearch and kibana I have followed the instructions on the elastic website.
I don’t spend here much time on installation issue due to the fact that they are all strongly dependent on operating systems and personal skills. Documentation and online forums will assist you in case of any problem.
After installation kibana was alive and kicking at http://localhost:5601/app/kibana
So, time is come to feed elasticsearch with some data.
I have suddenly thought to the NYC flight dataset available in the nycflights13 package, including on-time data for all flights that departed NYC (i.e. JFK, LGA or EWR) in 2013.
library(nycflights13)
data(flights)
flights
I have installed the elastic package from CRAN
The connect command established the connection with my local elasticsearch
library(elastic)
connect()
Then I sent the data frame to elasticsearch with the simple bulk command
docs_bulk(flights, index = "flights_nyc_2013_idx")
The index argument provide the index name to use and is strictly required for data.frame input (optional for file inputs).
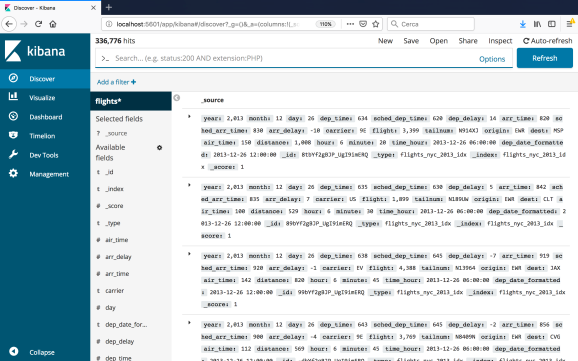
Opening kibana everything was ok and ready to play with

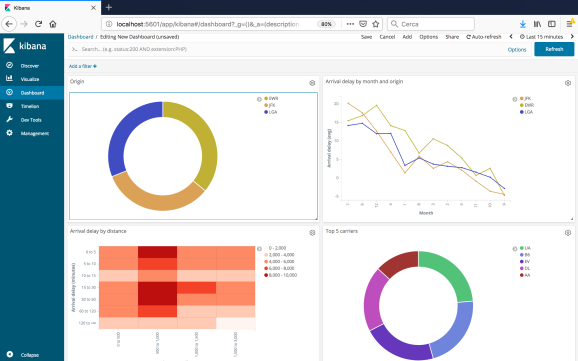
Then I have started to work on kibana for creating a dashboard for having useful insights from data. Not surprisingly june, july and December were the months at greater risk of delayed arrivals. Visualization and dashboard are ready for being included in websites trought specific iframe.

R-bloggers.com offers daily e-mail updates about R news and tutorials about learning R and many other topics. Click here if you're looking to post or find an R/data-science job.
Want to share your content on R-bloggers? click here if you have a blog, or here if you don't.
