
Flow charts in R
[This article was first published on R – Insights of a PhD, and kindly contributed to R-bloggers]. (You can report issue about the content on this page here)
Want to share your content on R-bloggers? click here if you have a blog, or here if you don't.
Want to share your content on R-bloggers? click here if you have a blog, or here if you don't.
Flow charts are an important part of a clinical trial report. Making them can be a pain though. One good way to do it seems to be with the grid and Gmisc packages in R. X and Y coordinates can be designated based on the center of the boxes in normalized device coordinates (proportions of the device space – 0.5 is this middle) which saves a lot of messing around with corners of boxes and arrows.
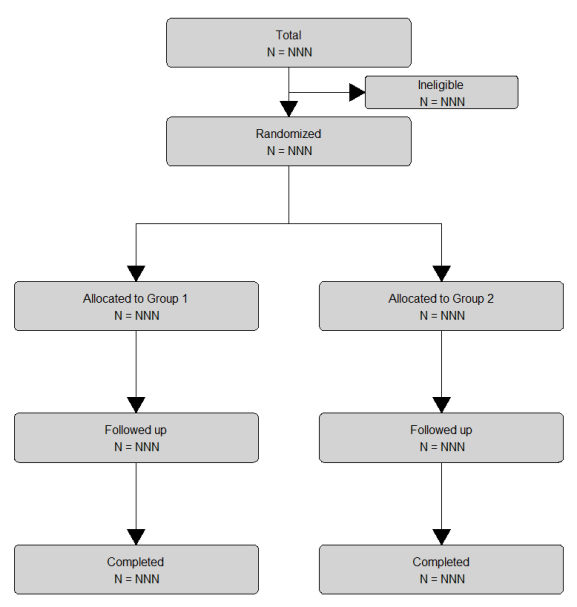
A very basic flow chart, based very roughly on the CONSORT version, can be generated as follows…
library(grid)
library(Gmisc)

grid.newpage()
# set some parameters to use repeatedly
leftx <- .25
midx <- .5
rightx <- .75
width <- .4
gp <- gpar(fill = "lightgrey")
# create boxes
(total <- boxGrob("Total\n N = NNN",
 x=midx, y=.9, box_gp = gp, width = width))

(rando <- boxGrob("Randomized\n N = NNN",
 x=midx, y=.75, box_gp = gp, width = width))
# connect boxes like this
connectGrob(total, rando, "v")

(inel <- boxGrob("Ineligible\n N = NNN",
 x=rightx, y=.825, box_gp = gp, width = .25, height = .05))

connectGrob(total, inel, "-")

(g1 <- boxGrob("Allocated to Group 1\n N = NNN",
 x=leftx, y=.5, box_gp = gp, width = width))
(g2 <- boxGrob("Allocated to Group 2\n N = NNN",
 x=rightx, y=.5, box_gp = gp, width = width))

connectGrob(rando, g1, "N")
connectGrob(rando, g2, "N")

(g11 <- boxGrob("Followed up\n N = NNN",
 x=leftx, y=.3, box_gp = gp, width = width))
(g21 <- boxGrob("Followed up\n N = NNN",
 x=rightx, y=.3, box_gp = gp, width = width))

connectGrob(g1, g11, "N")
connectGrob(g2, g21, "N")

(g12 <- boxGrob("Completed\n N = NNN",
 x=leftx, y=.1, box_gp = gp, width = width))
(g22 <- boxGrob("Completed\n N = NNN",
 x=rightx, y=.1, box_gp = gp, width = width))

connectGrob(g11, g12, "N")
connectGrob(g21, g22, "N")
Sections of code to make the boxes are wrapped in brackets to print them immediately. The code creates something like the following figure:
For detailed info, see the Gmisc vignette. This code is also on github.
To leave a comment for the author, please follow the link and comment on their blog: R – Insights of a PhD.
R-bloggers.com offers daily e-mail updates about R news and tutorials about learning R and many other topics. Click here if you're looking to post or find an R/data-science job.
Want to share your content on R-bloggers? click here if you have a blog, or here if you don't.