
Using R in SQL Server Reporting Services (SSRS)
Want to share your content on R-bloggers? click here if you have a blog, or here if you don't.
SQL Server Reporting services (SSRS) is an outstanding tool for creating, deploying and managing paginated, mobile, KPI reports as well as Power BI reports. Tool provides simple way to share and get data insights in your corporate environment.

(Photo source: Microsoft docs)
Using the privileges of R language to enrich your data, your statistical analysis or visualization is a simple task to get more out of your reports.
The best practice to embed R code into SSRS report is to create stored procedure and output the results to report. To demonstrate this, we will create two reports; one that will take two input parameters and the second one to demonstrate the usage of R visualization.
First, We will create a designated database and generate some sample data:
CREATE DATABASE R_SSRS;
GO
USE R_SSRS;
GO

CREATE TABLE R_data (
 v1 INT ,v2 INT,v_low INT,v_high INT,letter CHAR(1));
GO

CREATE OR ALTER PROCEDURE generate_data
AS
BEGIN
  INSERT INTO R_data(v1,v2,v_low,v_high,letter)
  SELECT TOP 10
    CAST(v1.number*RAND() AS INT) AS v1
   ,CAST(v2.number*RAND() AS INT) AS v2
   ,v1.low AS v_low
   ,v1.high AS v_high
   ,SUBSTRING(CONVERT(varchar(40), NEWID()),0,2) AS letter
  FROM master..spt_values AS v1
  CROSS JOIN master..spt_values AS v2
  WHERE  v1.[type] = 'P' AND v2.[type] = 'P'
 ORDER BY NEWID() ASC;
END
GO
EXEC generate_data;
GO 10
For the first report we will create a dynamic report, where user will be able to select two parameters. Based on select of the parameters, the resulted dataset will be passed to R, where with additional R code, we will generate summary statistics.
The idea is, to have the values “v1” and “letter” parametrized:
SELECT * FROM R_data
WHERE
 v1 > 400 -- replace this with parameter; e.g.: @v1
AND letter IN ('1','2','3') -- replace this with parameter; e.g.: @letters
So in this case, we will create a stored procedure, that will get the data from T-SQL and call external procedure for execution of R Code. This procedure will be as:
CREATE OR ALTER PROCEDURE sp_R1(
   @v1 INT
  ,@lett VARCHAR(20)
) AS
BEGIN
 DECLARE @myQuery NVARCHAR(1000)

  CREATE TABLE #t (let CHAR(1))
  INSERT INTO #t
  SELECT value
  FROM STRING_SPLIT(@lett,',')

 SET @myQuery = N'
    SELECT * FROM R_data
    WHERE
    v1 > '+CAST(@v1 AS VARCHAR(10))+'
    AND letter IN (SELECT * FROM #t)'

EXEC sp_execute_external_script
 @language = N'R'
 ,@script = N'
   df <- InputDataSet
   OutputDataSet <- data.frame(summary(df))'
  ,@input_data_1 = @myQuery
WITH RESULT SETS
((v1 NVARCHAR(100)
 ,v2 NVARCHAR(100)
 ,freq NVARCHAR(100)))
END;
GO
By testing, we can see that passing both parameters (one single-valued and one multi-valued) will return result of R code:
EXEC sp_R1 @v1 = 200, @lett = '1,2,3'
Both of these parameters will be used in report for selection on data (or filtering the data). In SQL Server 2016 Report Builder, we create a blank report, add data source and create a new dataset, using stored procedure:
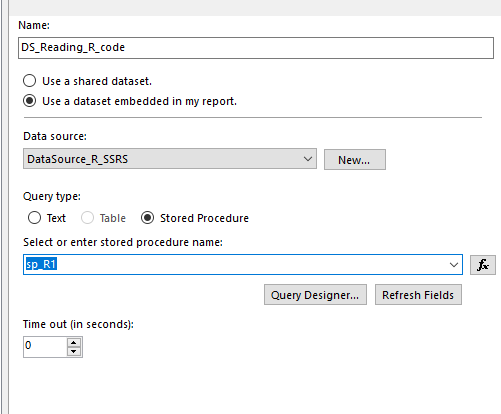
Once the dataset is added and stored procedure tested, reporting builder will automatically create report parameters:

In addition, we need to set up the parameters, so, adding additional dataset for the paramteres to have a controlled set of available values, and adding this pool of values to each of the parameters, by selecting the dataset, where the parameters will be taken from.

For the multi-valued parameter, we also need to specify that user can select more than one value at the time. By letting the reporting builder know that “lett” parameter will be parsed back as a string of multiple values, we must select “Allow multiple values”.

Once this is completed, both parameters will be shown as a drop-down selection boxes, where user will get the results back, based upon the selection made.

At the end, report should look very similar to this, where the table is result generated by R code, the rest is T-SQL results and the beautiful Reporting Services.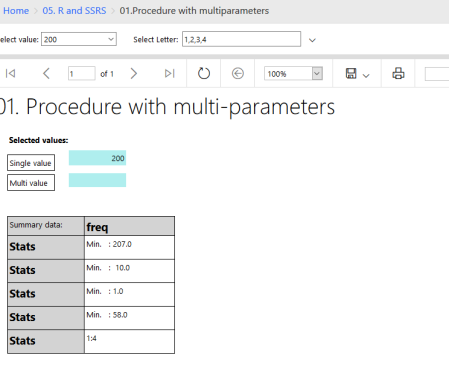
For the second report, we will create a new stored procedure, that will generate a boxplot for selected values retrieved from the user selection.
The procedure will roughly remain the same, just the R code will be changed in order to be able to return the graph (complete procedure is in the code):
EXEC sp_execute_external_script
 @language = N'R'
 ,@script = N'
  df <- InputDataSet
  image_file <- tempfile()
  jpeg(filename = image_file, width = 400, height = 400)
  boxplot(df$v1~df$letter)
  dev.off()
  OutputDataSet <- data.frame(data=readBin(file(image_file, "rb"), what=raw(), n=1e6))'
In addition to that, on our new report, we will need to show the returned value of this procedure (or simply result) as a graph.
On report canvas drag an image and change the settings of this image as following:

Users will be now able to selected the values and based on their selection, the R graph generated inside SSRS report will be changed respectively.
This next Figure show just this, how simple it is for the user to change the selection (add or remove new values) and the boxplot graph is redrawn with updated values.

Both demos should help you leverage the usage of R scripts and R visualizations in your corporate reporting service and bring some additional user interface dynamics into it.
As always, the complete code and reports are available at Github. And code will also hold my random generated dataset, if you want to get same results as in this blogpost.
Happy RCoding 
R-bloggers.com offers daily e-mail updates about R news and tutorials about learning R and many other topics. Click here if you're looking to post or find an R/data-science job.
Want to share your content on R-bloggers? click here if you have a blog, or here if you don't.