
Undemocratic Democracies
Want to share your content on R-bloggers? click here if you have a blog, or here if you don't.
I’ve always thought that it was ironic that most countries with the word “Democratic” in their name are exceptionally un-democratic in reality. So I was very interested in the following post on Reddit this week showing exactly this (https://www.reddit.com/r/dataisbeautiful/comments/7nkyek/countries_with_the_word_democratic_in_their/).
However, there are only 8 countries that have “democratic” in their name: People’s Democratic Republic of Algeria, Democratic Republic of the Congo, Democratic Republic of Timor-Leste, Federal Democratic Republic of Ethiopia, Lao People’s Democratic Republic, Democratic People’s Republic of Korea, Federal Democratic Republic of Nepal, and the Democratic Socialist Republic of Sri Lanka. This and the fact that I am back teaching next week got me thinking that this might be a nice example to show how two-sample t-tests work.
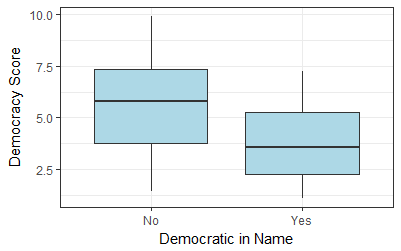
The 8 “democratic” countries have an overall democracy index score of 3.89 with a sample standard deviation of 2.174942. This contrasts with a mean and standard deviation of 5.602013 and 2.172326 for the remaining 159 countries in the Economist Intelligence Unit’s democracy index (https://en.wikipedia.org/wiki/Democracy_Index).
Let’s conduct a two-sample t-test that assumes equal variances to test whether this difference in means is statistically significant. The null hypothesis is that both sample means are equal. This is a two-tailed test. The test statistic follows Gosset’s t-distribution with n1+n2-2 degrees of freedom (159+8-2=165). The test statistic is calculated (formula here: https://en.wikipedia.org/wiki/Student%27s_t-test):
s = sqrt(((158*2.172326^2)+(7*2.174942^2))/(159+8-2))
t = (5.602013-3.89)/(s*(sqrt(1/159+1/8)))=2.1749
which allows us to reject at the conventional alpha of 0.05. The p-value is ~0.03 meaning we would not be able to reject at the 1% level. Interestingly, if you do not follow the equal variance assumption, you can no longer reject the null at the 5% level.
Hopefully, this example will be of interest to people teaching stats and econometrics for undergrads!
rm(list = ls())
other <- c(9.93, 9.5,	9.39,	9.26,	9.2,	9.15,	9.15,	9.09,	9.03,	9.01,	8.81,	8.8,	8.63,	8.41,	8.39,	8.36,	8.3,	8.28,	8.17,	7.99,	7.98,	7.98,	7.94,	7.92,	7.92,	7.88,	7.87,	7.86,	7.85,	7.85,	7.82,	7.81,	7.79,	7.78,	7.77,	7.65,	7.51,	7.47,	7.41,	7.39,	7.31,	7.29,	7.23,	7.13,	7.1,	7.01,	6.97,	6.96,	6.94,	6.9,	6.83,	6.77,	6.75,	6.75,	6.72,	6.67,	6.67,	6.65,	6.64,	6.62,	6.62,	6.59,	6.57,	6.54,	6.47,	6.42,	6.4,	6.38,	6.31,	6.27,	6.25,	6.21,	6.03,	6.01,	5.99,	5.93,	5.92,	5.92,	5.91,	5.81,	5.76,	5.73,	5.72,	5.7,	5.7,	5.67,	5.64,	5.63,	5.55,	5.33,	5.31,	5.26,	5.23,	5.07,	5.04,	4.93,	4.93,	4.92,	4.87,	4.86,	4.81,	4.77,	4.7,	4.68,	4.55,	4.5,	4.49,	4.33,	4.27,	4.2,	4.08,	4.02,	4.02,	3.96,	3.96,	3.96,	3.88,	3.85,	3.81,	3.74,	3.71,	3.54,	3.46,	3.46,	3.4,	3.38,	3.32,	3.31,	3.24,	3.18,	3.14,	3.14,	3.07,	3.06,	3.05,	3.04,	3.03,	2.91,	2.91,	2.83,	2.79,	2.75,	2.65,	2.55,	2.4,	2.37,	2.37,	2.34,	2.25,	2.06,	1.98,	1.95,	1.93,	1.89,	1.83,	1.7,	1.61,	1.5,	1.43)
demo <- c(7.24, 6.48, 4.86, 3.6, 3.56, 2.37, 1.93, 1.08)

mean(other) ; sd(other) ; length(other)
mean(demo) ; sd(demo) ; length(demo)

t.test(other, demo, var.equal = T)
s = sqrt(((158*2.172326^2)+(7*2.174942^2))/(159+8-2))
t = (5.602013-3.89)/(s*(sqrt(1/159+1/8)))

t.test(other, demo, var.equal = F)

library(ggplot2)
data1 <- data.frame(Score = other, Name = "No")
data2 <- data.frame(Score = demo, Name = "Yes")
data <- rbind(data1, data2)

ggplot(data, aes(Name, Score)) +
  geom_boxplot(fill="lightblue") +
  theme_bw() +
  xlab("Democratic in Name") +
  ylab("Democracy Score")

R-bloggers.com offers daily e-mail updates about R news and tutorials about learning R and many other topics. Click here if you're looking to post or find an R/data-science job.
Want to share your content on R-bloggers? click here if you have a blog, or here if you don't.