
Check your prior posterior overlap (PPO) – MCMC wrangling in R made easy with `MCMCvis`
Want to share your content on R-bloggers? click here if you have a blog, or here if you don't.
- R-hat (AKA Gelman-Rubin statistic) – used to assess convergence of chains in the model
- Visual assessment of chains – used to assess whether posterior chains mixed well (convergence)
- Visual assessment of posterior distribution shape – used to determine if the posterior distribution is constrained
- Posterior predictive check (predicting data using estimated parameters) – used to make sure that the model can generate the data used in the model
PPO
One check, however, is often missing: a robust assessment of the degree to which the prior is informing the posterior distribution. Substantial influence of the prior on the posterior may not be apparent through the use of R-hat and visual checks alone. Version 0.9.2 of MCMCvis (now available on CRAN), makes quantifying and plotting the prior posterior overlap (PPO) simple.
MCMCvis is an R package designed to streamline analysis of Bayesian model results derived from MCMC samplers (e.g., JAGS, BUGS, Stan). It can be used to easily visualize, manipulate, and summarize MCMC output. The newest version is full of new features – a full tutorial can be found here.
An example
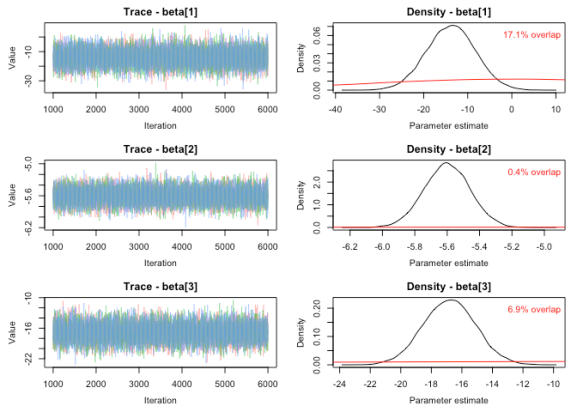
To check PPO for a model, we will use the function MCMCtrace. As the function is used to generate trace and density plots, checking for PPO is barely more work than just doing the routine checks that one would ordinarily perform. The function plots trace plots on the left and density plots for both the posterior (black) and prior (red) distributions on the right. The function calculates the percent overlap between the prior and posterior and prints this value on the plot. See ?MCMCtrace in R for details regarding the syntax.
#install package
install.packages('MCMCvis', repos = "http://cran.case.edu")

#load package
require(MCMCvis)

#load example data
data(MCMC_data)

#simulate data from the prior used in your model
#number of iterations should equal the number of draws times the number of chains (although the function will adjust if the correct number of iterations is not specified)
#in JAGS: parameter ~ dnorm(0, 0.001)
PR <- rnorm(15000, 0, 32)

#run the function for just beta parameters
MCMCtrace(MCMC_data, params = 'beta', priors = PR, pdf = FALSE)
Why check?
Checking the PPO has particular utility when trying to determine if the parameters in your model are identifiable. If substantial PPO exists, the prior may simply be dictating the posterior distribution – the data may have little influence on the results. If a small degree of PPO exists, the data was informative enough to overcome the influence of the prior. In the field of ecology, nonidentifiability is a particular concern in some types of mark-recapture models. Gimenez (2009) developed quantitative guidelines to determine when parameters are robustly identifiable using PPO.
While a large degree of PPO is not always a bad thing (e.g., substantial prior knowledge about the system may result in very informative priors used in the model), it is important to know where data was and was not informative for parameter estimation. The degree of PPO that is acceptable for a particular model will depend on a great number of factors, and may be somewhat subjective (but see Gimenez [2009] for a less subjective case). Like other checks, PPO is just one of many tools to be used for model assessment. Finding substantial PPO when unexpected may suggest that further model manipulation is needed. Happy model building!
Other MCMCvis improvements
Check out the rest of the new package freatures, including the option to calculate the number of effective samples for each parameter, ability to take arguments in the form of a ‘regular expression’ for the params argument, ability to retain the structure of all parameters in model output (e.g., parameters specified as matrices in the model are summarized as matrices).
Follow Casey Youngflesh on Twitter @caseyyoungflesh. The MCMCvis source code can be found on GitHub.
R-bloggers.com offers daily e-mail updates about R news and tutorials about learning R and many other topics. Click here if you're looking to post or find an R/data-science job.
Want to share your content on R-bloggers? click here if you have a blog, or here if you don't.