
yorkr pads up for the Twenty20s: Part 1- Analyzing team”s match performance
Want to share your content on R-bloggers? click here if you have a blog, or here if you don't.
There are two ways of constructing a software design: One way is to make it so simple that there are obviously no deficiencies and the other way is to make it so complicated that there are no obvious deficiencies.
C.A.R. Hoare, The 1980 ACM Turing Award Lecture
One of my most productive days was throwing away 1000 lines of code.
Ken Thompson
Debugging is twice as hard as writing the code in the first place. Therefore, if you write the code as cleverly as possible, you are, by definition, not smart enough to debug it.
Brian W. Kernighan and P. J. Plauger in The Elements of Programming Style.
“If debugging is the process of removing software bugs, then programming must be the process of putting them in.”
Edsger Dijkstra
Introduction
In this post I have added functions to my R package ‘yorkr’ that will allow for analysis of Twenty20 matches. yorkr is already available in R and the Twenty20 functionality will be available with yorkr_0.0.4. This package is based on data from Cricsheet. I have now added functionality to perform analysis of T20 matches in addition the existing functionality for analysing ODI matches
The yorkr package provides functions to convert the yaml files to more easily R consumable entities, namely dataframes. In fact all ODI & T20 matches have already been converted and are available for use at yorkrData. This post can be viewed at RPubs at yorkrT20-Part1 or can also be downloaded as a PDF document yorkrT20-1.pdf
Note 1: The package in its current form can handle ODI & Twenty 20matches. The package will be enhanced to IPL matches later
2. Install the package from CRAN
library(yorkr)
rm(list=ls())
2a. New functionality for Twenty20
I had to create 2 new functions had to be created for converting Twenty20 yaml files to RData. They are
- convertYaml2RDataframeT20
- convertAllYaml2RDataframesT20
Note: Most of the existing functions created for ODI matches, also work with the converted T20 RData files, as can be seen below.
3. Convert and save T20 yaml file to dataframe
This function will convert a T20 yaml file in the format as specified in Cricsheet to dataframe. This will be saved as as RData file in the target directory. The name of the file wil have the following format team1-team2-date.RData. An example of how a yaml file can be converted to a dataframe and saved is shown below.
#Available in yorkr_0.0.4
convertYaml2RDataframeT20("211028.yaml",".",".")
## [1] "./211028.yaml"
## [1] "first loop"
## [1] "second loop"
4. Convert and save all T20 yaml files to dataframes
This function will convert all T20 yaml files from a source directory to dataframes, and save it in the target directory, with the names as mentioned above. Since I have already done this, I will not be executing this again. You can download the zip of all the converted RData files from Github at T20-matches
#Available in yorkr_0.0.4
#convertAllYaml2RDataframesT20("./t20s","./data")
5. yorkrData – A Github repositiory
Cricsheet had a total of 458 Twenty20 matches. Out of which 5 files seemed to have problem. The remaining 453 T20 matches have been converted to RData.
All the converted RData files can be accessed from my Github link yorkrData under the folder T20-matches
You can download the the zip of the files and use it directly in the functions as follows
6. Load the match data as dataframes
For this post I will be using the Twenty20 match data from 5 random matches between 10 different opposing teams/countries. For this I will directly use the converted RData files rather than getting the data through the getMatchDetails() as shown below
With the RData we can load the data in 2 ways
A. With getMatchDetails()
- With getMatchDetails() using the 2 teams and the date on which the match occured
afg_ire <- getMatchDetails("Afghanistan","Ireland","2010-02-09",dir="../../data")
dim(afg_ire)
## [1] 245  25
or
B.Directly load RData into your code.
The match details will be loaded into a dataframe called ’overs’ which you can assign to a suitable name as below
The randomly selected matches are
- Australia vs India – 2007-09-22
- England vs New Zealand – 2012-09-29
- Pakistan vs South Africa – 2010-10-26
- Sri Lanka vs West Indioes -2012-10-07
- Bangladesh vs Zimbabwe -2016-01-15
load("../../data/Australia-India-2007-09-22.RData")
aus_ind <- overs
load("../../data/England-New Zealand-2012-09-29.RData")
eng_nz <- overs
load("../../data/Pakistan-South Africa-2010-10-26.RData")
pak_sa <- overs
load("../../data/Sri Lanka-West Indies-2012-10-07.RData")
sl_wi<- overs
load("../../data/Bangladesh-Zimbabwe-2016-01-15.RData")
ban_zim <- overs
7. Team batting scorecard
Compute and display the batting scorecard of the teams in the match. The top batsmen in are Yuvraj Singh(Ind), ML Hayden(Aus), JP Duminy(SA) and Jayawardene(SL)
teamBattingScorecardMatch(aus_ind,'India')
## Total= 181
## Source: local data frame [7 x 5]
##
##        batsman ballsPlayed fours sixes  runs
##         (fctr)       (int) (dbl) (dbl) (dbl)
## 1    G Gambhir          25     4     0    24
## 2     V Sehwag          12     1     0     9
## 3   RV Uthappa          27     1     3    34
## 4 Yuvraj Singh          30     5     5    70
## 5     MS Dhoni          18     4     1    36
## 6    RG Sharma           5     0     1     8
## 7    IK Pathan          NA     0     0     0
teamBattingScorecardMatch(aus_ind,'Australia')
## Total= 165
## Source: local data frame [9 x 5]
##
##        batsman ballsPlayed fours sixes  runs
##         (fctr)       (int) (dbl) (dbl) (dbl)
## 1 AC Gilchrist          13     2     2    22
## 2    ML Hayden          44     4     4    62
## 3     BJ Hodge          10     0     1    11
## 4    A Symonds          26     3     2    43
## 5   MEK Hussey          12     0     1    13
## 6    MJ Clarke           3     0     0     3
## 7    BJ Haddin           7     0     0     5
## 8        B Lee           2     0     0     2
## 9   MG Johnson           1     1     0     4
teamBattingScorecardMatch(pak_sa,'South Africa')
## Total= 115
## Source: local data frame [6 x 5]
##
##          batsman ballsPlayed fours sixes  runs
##           (fctr)       (int) (dbl) (dbl) (dbl)
## 1       GC Smith          12     3     0    13
## 2      LE Bosman           4     0     0     2
## 3 AB de Villiers           3     0     0     0
## 4      JP Duminy          45     5     0    41
## 5      CA Ingram          38     4     2    46
## 6      DA Miller           5     3     0    13
teamBattingScorecardMatch(sl_wi,'Sri Lanka')
## Total= 98
## Source: local data frame [10 x 5]
##
##             batsman ballsPlayed fours sixes  runs
##              (fctr)       (int) (dbl) (dbl) (dbl)
## 1  DPMD Jayawardene          36     2     0    33
## 2        TM Dilshan           2     0     0     0
## 3     KC Sangakkara          26     2     0    22
## 4        AD Mathews           5     0     0     1
## 5       BMAJ Mendis           3     0     0     3
## 6       NLTC Perera           5     0     0     3
## 7   HDRL Thirimanne           7     0     0     4
## 8   KMDN Kulasekara          12     3     1    26
## 9        SL Malinga          12     0     0     5
## 10       BAW Mendis           2     0     0     1
8. Plot the team batting partnerships
The functions below plot the team batting partnetship in the match Note: Many of the plots include an additional parameters plot which is either TRUE or FALSE. The default value is plot=TRUE. When plot=TRUE the plot will be displayed. When plot=FALSE the data frame will be returned to the user. The user can use this to create an interactive chary using one of th epackages like rcharts, ggvis,googleVis or plotly.
teamBatsmenPartnershipMatch(pak_sa,"Pakistan")

teamBatsmenPartnershipMatch(eng_nz,"New Zealand",plot=TRUE)

teamBatsmenPartnershipMatch(ban_zim,"Bangladesh",plot=FALSE)
##            batsman      nonStriker runs
## 1      Tamim Iqbal   Soumya Sarkar   19
## 2      Tamim Iqbal   Sabbir Rahman   10
## 3    Soumya Sarkar     Tamim Iqbal    7
## 4    Sabbir Rahman     Tamim Iqbal   15
## 5    Sabbir Rahman   Shuvagata Hom   10
## 6    Sabbir Rahman Mushfiqur Rahim   21
## 7    Shuvagata Hom   Sabbir Rahman    6
## 8  Mushfiqur Rahim   Sabbir Rahman   23
## 9  Mushfiqur Rahim Shakib Al Hasan    3
## 10 Shakib Al Hasan Mushfiqur Rahim    4
## 11 Shakib Al Hasan     Mahmudullah    5
## 12 Shakib Al Hasan     Nurul Hasan   11
## 13     Mahmudullah Shakib Al Hasan    7
## 14     Nurul Hasan Shakib Al Hasan    7
teamBatsmenPartnershipMatch(aus_ind,"India",plot=TRUE)

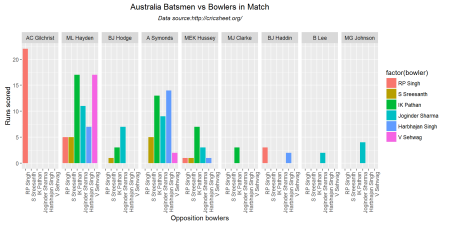
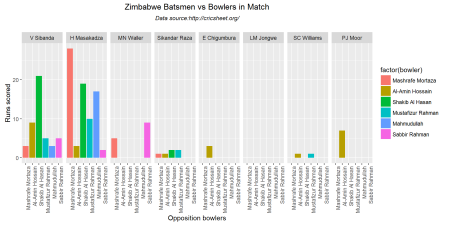
9. Batsmen vs Bowler
The function below computes and plots the performances of the batsmen vs the bowlers. As before the plot parameter can be set to TRUE or FALSE. By default it is plot=TRUE
teamBatsmenVsBowlersMatch(pak_sa,'Pakistan',plot=TRUE)

teamBatsmenVsBowlersMatch(aus_ind,'Australia',plot=TRUE)
teamBatsmenVsBowlersMatch(ban_zim,'Zimbabwe',plot=TRUE)
m <- teamBatsmenVsBowlersMatch(sl_wi,'West Indies',plot=FALSE)
m
## Source: local data frame [25 x 3]
## Groups: batsman [?]
##
##       batsman          bowler runsConceded
##        (fctr)          (fctr)        (dbl)
## 1   J Charles      AD Mathews            0
## 2  MN Samuels      AD Mathews            8
## 3  MN Samuels KMDN Kulasekara            5
## 4  MN Samuels      SL Malinga           39
## 5  MN Samuels      BAW Mendis            7
## 6  MN Samuels     A Dananjaya            4
## 7  MN Samuels     BMAJ Mendis           15
## 8    CH Gayle      AD Mathews            0
## 9    CH Gayle KMDN Kulasekara            1
## 10   CH Gayle      SL Malinga            2
## ..        ...             ...          ...
10. Bowling Scorecard
This function provides the bowling performance, the number of overs bowled, maidens, runs conceded and wickets taken for each match
teamBowlingScorecardMatch(eng_nz,'England')
## Source: local data frame [5 x 5]
##
##       bowler overs maidens  runs wickets
##       (fctr) (int)   (int) (dbl)   (dbl)
## 1  DR Briggs     4       0    36       1
## 2    ST Finn     4       0    16       3
## 3 TT Bresnan     4       0    29       1
## 4   GP Swann     4       0    20       1
## 5  SCJ Broad     4       0    37       0
teamBowlingScorecardMatch(eng_nz,'New Zealand')
## Source: local data frame [7 x 5]
##
##          bowler overs maidens  runs wickets
##          (fctr) (int)   (int) (dbl)   (dbl)
## 1      KD Mills     4       0    23       1
## 2    TG Southee     2       0    32       0
## 3    DL Vettori     4       0    20       1
## 4   NL McCullum     4       0    22       1
## 5      RJ Nicol     3       0    29       0
## 6  JEC Franklin     1       0    12       0
## 7 DAJ Bracewell     1       0     8       1
teamBowlingScorecardMatch(aus_ind,'Australia')
## Source: local data frame [6 x 5]
##
##       bowler overs maidens  runs wickets
##       (fctr) (int)   (int) (dbl)   (dbl)
## 1      B Lee     4       0    25       0
## 2 NW Bracken     4       0    38       0
## 3   SR Clark     4       0    38       0
## 4 MG Johnson     4       0    31       4
## 5  A Symonds     3       0    37       0
## 6  MJ Clarke     1       0    13       1
11. Wicket Kind
The plots below provide the bowling kind of wicket taken by the bowler (caught, bowled, lbw etc.)
teamBowlingWicketKindMatch(aus_ind,"India")

teamBowlingWicketKindMatch(aus_ind,"Australia")

teamBowlingWicketKindMatch(pak_sa,"South Africa")

m <-teamBowlingWicketKindMatch(sl_wi,"Sri Lanka",plot=FALSE)
m
##            bowler wicketKind wicketPlayerOut runs
## 1      AD Mathews     caught       J Charles   11
## 2      BAW Mendis        lbw        CH Gayle   12
## 3      BAW Mendis        lbw        DJ Bravo   12
## 4      BAW Mendis     caught      KA Pollard   12
## 5      BAW Mendis        lbw      AD Russell   12
## 6     A Dananjaya     caught      MN Samuels   16
## 7 KMDN Kulasekara   noWicket        noWicket   22
## 8      SL Malinga   noWicket        noWicket   54
## 9     BMAJ Mendis   noWicket        noWicket   20
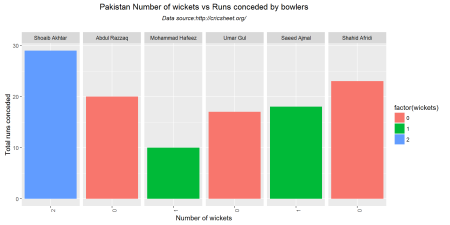
12. Wicket vs Runs conceded
The plots below provide the wickets taken and the runs conceded by the bowler in the match
teamBowlingWicketRunsMatch(pak_sa,"Pakistan")
teamBowlingWicketRunsMatch(aus_ind,"Australia")

m <-teamBowlingWicketRunsMatch(sl_wi,"West Indies",plot=FALSE)
m
## Source: local data frame [6 x 5]
##
##       bowler overs maidens  runs wickets
##       (fctr) (int)   (int) (dbl)   (chr)
## 1   S Badree     4       0    24       1
## 2  R Rampaul     3       0    31       1
## 3 MN Samuels     4       0    15       2
## 4   CH Gayle     2       0    14       0
## 5  SP Narine     4       1     9       4
## 6  DJG Sammy     2       0     6       2
13. Wickets taken by bowler
The plots provide the wickets taken by the bowler
m <-teamBowlingWicketMatch(eng_nz,'England',plot=FALSE)
m
##       bowler wicketKind wicketPlayerOut runs
## 1    ST Finn        lbw      MJ Guptill   16
## 2    ST Finn     caught     BB McCullum   16
## 3   GP Swann     caught        RJ Nicol   20
## 4  DR Briggs     caught   KS Williamson   36
## 5    ST Finn     caught     LRPL Taylor   16
## 6 TT Bresnan    run out    JEC Franklin   29
## 7  SCJ Broad   noWicket        noWicket   37
teamBowlingWicketMatch(sl_wi,"Sri Lanka")

teamBowlingWicketMatch(eng_nz,"New Zealan")

14. Bowler Vs Batsmen
The functions compute and display how the different bowlers of the country performed against the batting opposition.
teamBowlersVsBatsmenMatch(ban_zim,"Bangladesh")

teamBowlersVsBatsmenMatch(aus_ind,"India")

teamBowlersVsBatsmenMatch(eng_nz,"England")

m <- teamBowlersVsBatsmenMatch(pak_sa,"Pakistan",plot=FALSE)
m
## Source: local data frame [19 x 3]
## Groups: bowler [?]
##
##             bowler        batsman runsConceded
##             (fctr)         (fctr)        (dbl)
## 1    Shoaib Akhtar       GC Smith            5
## 2    Shoaib Akhtar      LE Bosman            1
## 3    Shoaib Akhtar AB de Villiers            0
## 4    Shoaib Akhtar      JP Duminy            8
## 5    Shoaib Akhtar      CA Ingram           11
## 6    Shoaib Akhtar      DA Miller            4
## 7     Abdul Razzaq       GC Smith            8
## 8     Abdul Razzaq      LE Bosman            1
## 9     Abdul Razzaq      CA Ingram            1
## 10    Abdul Razzaq      DA Miller            9
## 11 Mohammad Hafeez       GC Smith            0
## 12 Mohammad Hafeez      JP Duminy            7
## 13 Mohammad Hafeez      CA Ingram            3
## 14        Umar Gul      JP Duminy            6
## 15        Umar Gul      CA Ingram           11
## 16     Saeed Ajmal      JP Duminy           10
## 17     Saeed Ajmal      CA Ingram            7
## 18   Shahid Afridi      JP Duminy           10
## 19   Shahid Afridi      CA Ingram           13
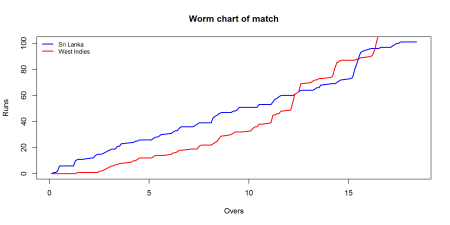
15. Match worm graph
The plots below provide the match worm graph for the Twenty 20 matches
matchWormGraph(aus_ind,'Australia',"India")

matchWormGraph(sl_wi,'Sri Lanka',"West Indies")
Conclusion
This post included all functions between 2 opposing countries from the package yorkr for Twenty20 matches.As mentioned above the yaml match files have been already converted to dataframes and are available for download from Github. Go ahead and give it a try
To be continued. Watch this space!
You may also like
- Introducing cricketr! : An R package to analyze performances of cricketers
- Cricket analytics with cricketr
- Introducing cricket package yorkr-Part1:Beaten by sheer pace!.
- What’s up Watson? Using IBM Watson’s QAAPI with Bluemix, NodeExpress
- Introducing cricket package yorkr: Part 3-Foxed by flight!
- Natural language processing: What would Shakespeare say?
- Experiment with deblurring using OpenCV
- Unravelling the mysteries of life
- Presentation on “Intelligent Networks, CAMEL protocol, services & applications”

R-bloggers.com offers daily e-mail updates about R news and tutorials about learning R and many other topics. Click here if you're looking to post or find an R/data-science job.
Want to share your content on R-bloggers? click here if you have a blog, or here if you don't.