
Swedish Real Estate Prices | rvest, RSelenium, ggplot2
Want to share your content on R-bloggers? click here if you have a blog, or here if you don't.
Finally got myself an internet connection at home, so i can start with another scraping project. This time i thought it would be nice to try a non-English site that also has coordinate data in each post. Settled on a site and started cracking.
As always, i began with inspecting the site’s html source code. I was hoping that the site doesn’t incorporate any javascript, but unfortunatley it does. That means i’m gonna have to use RSelenium again in order to simulate some kind of human interaction. In this case, i need it to click the Next button in the search results so that i could scrape the next set of search results. One issue that i wasn’t expecting is the coordinate data being mushed together with other information that i didn’t need, but nothing the stringr package can’t fix.
Since most of the information for each real estate posting is included in the post itself and not in the search results, the first loop would need to get all the links, while the second loop would have to actually navigate to each of these links and retrieve all the information available.
The code i used for the scraping is below:
library(dplyr)
library(RSelenium)
library(rvest)
library(stringr)
library(beepr)

link = "Link to first page of results goes here"
page = 1
link = paste(link, as.character(page), sep ="")

checkForServer() #Check if server file is available
startServer() #Start the server
mybrowser = remoteDriver(browser = "chrome") #Change the browser to chrome
mybrowser$open(silent = TRUE) #Open the browser

mybrowser$navigate(link) #Navigate to URL

#find button and click
wxbutton = mybrowser$findElement(using = 'css selector', "div.map-toolbar__item.map-toolbar__item--fullscreen.tooltip")
wxbutton$clickElement()

#get the source
mybrowser$getPageSource()[[1]] -> source

newlist = c("ä", "ö", "ü", "Ä", "Ö", "Ü", "ß")
newlist_2 = c("a", "o", "u", "A", "O", "U", "B")

swedChar = function(source, newlist, newlist_2){

  for(i in 1: length(newlist)){

    source %>% str_replace_all(pattern = newlist[i], replacement = newlist_2[i]) -> source

  }
  return(source)
}

swedChar(source, newlist, newlist_2) -> source

html(source) -> source

source %>% html_nodes("#hitlists") %>% html_nodes("#hitlist") %>%
  html_nodes("a.hit__anchor.js__hit__anchor") %>% html_attr("href") -> Links #links

source %>% html_nodes("#hitlists") %>% html_nodes("#hitlist") %>%
  html_nodes("a.hit__anchor.js__hit__anchor") %>% html_attr("data-meta") -> meta #meta with long/lat coord

meta %>% str_replace_all(pattern = """, replacement = "") %>%
  str_replace_all(pattern = ":", replacement = "") -> meta #remove backspace and colon

meta %>% str_locate("longitude") -> x #character location of "longitude"

x[,1] %>% as.integer() -> start #where "longitude" begins
x[,2] %>% as.integer() -> end #where "longitude" ends

#locate end of "longitude" and take next 10 characters, then convert numeric
substr(meta, end+1, end+10) %>% as.numeric() -> Longitudes

#do same for "latitude"
meta %>% str_locate("latitude") -> x

x[,1] %>% as.integer() -> start
x[,2] %>% as.integer() -> end

substr(meta, end+1, end+10) %>% as.numeric() -> Latitudes

data.frame(Links, meta, Latitudes, Longitudes) -> df

for(i in 2:710){ #710 calculated based on total search results

  link = "Linke goes here again"
  page = i
  link = paste(link, as.character(page), sep ="")

  wxbutton = mybrowser$findElement(using = 'css selector', "div.map-toolbar__item.map-toolbar__item--fullscreen.tooltip")
  wxbutton$clickElement()

  mybrowser$navigate(link)
  Sys.sleep(5)

  mybrowser$getPageSource()[[1]] -> source

  swedChar(source, newlist, newlist_2) -> source

  html(source) -> source

  source %>% html_nodes("#hitlists") %>% html_nodes("#hitlist") %>%
    html_nodes("a.hit__anchor.js__hit__anchor") %>% html_attr("href") -> Links #links

  source %>% html_nodes("#hitlists") %>% html_nodes("#hitlist") %>%
    html_nodes("a.hit__anchor.js__hit__anchor") %>% html_attr("data-meta") -> meta #meta with long/lat coord

  meta %>% str_replace_all(pattern = """, replacement = "") %>%
    str_replace_all(pattern = ":", replacement = "") -> meta #remove backspace and colon

  meta %>% str_locate("longitude") -> x #character location of "longitude"

  x[,1] %>% as.integer() -> start #where "longitude" begins
  x[,2] %>% as.integer() -> end #where "longitude" ends

  #locate end of "longitude" and take next 10 characters, then convert numeric
  substr(meta, end+1, end+10) %>% as.numeric() -> Longitudes

  #do same for "latitude"
  meta %>% str_locate("latitude") -> x

  x[,1] %>% as.integer() -> start
  x[,2] %>% as.integer() -> end

  substr(meta, end+1, end+10) %>% as.numeric() -> Latitudes

  data.frame(Links, meta, Latitudes, Longitudes) -> df_2

  rbind(df, df_2) -> df

}

beep()
Sys.sleep(0.2)
beep()
Sys.sleep(0.2)
beep()
Sys.sleep(0.2)
write.csv(df, "Final_File.csv", row.names = FALSE)

#______________Create list with property details________________________

fURL = "URL to the site's homepage"

link = paste(fURL, df[1,1], sep = "")

mybrowser$navigate(link)

mybrowser$getPageSource()[[1]] -> source

swedChar(source, newlist, newlist_2) -> source

html(source) -> source

wxbutton = mybrowser$findElement(using = 'css selector', 'article.property__simple-number.property__show-more')
wxbutton$clickElement()

source %>% html_nodes(".decks") %>%
  html_nodes(".property__detailed-numbers") %>% html_nodes(".property__table-cell") %>%
  html_text() %>% str_trim() -> details

list(details) -> details

for(i in 1:nrow(df)){

  fURL = "Home page URL again"

  link = paste(fURL, df[i,1], sep = "")

  mybrowser$navigate(link)

  try(mybrowser$getPageSource()[[1]] -> source)

  swedChar(source, newlist, newlist_2) -> source

  try(html(source) -> source)

  try(wxbutton = mybrowser$findElement(using = 'css selector', 'article.property__simple-number.property__show-more'))
  try(wxbutton$clickElement())

  try(source %>% html_nodes(".decks") %>%
    html_nodes(".property__detailed-numbers") %>% html_nodes(".property__table-cell") %>%
    html_text() %>% str_trim() -> details_1)

  details[[i]] -> details_1

  print(i)
}

#close browser and server
mybrowser$close()
mybrowser$closeServer()

#End of loop notification
beep()
Sys.sleep(0.2)
beep()
Sys.sleep(0.2)
beep()
Sys.sleep(0.2)

#_______________Get unique header names___________________________

seq(1,length(details[[1]]), by = 2) -> header_labels

details[[1]][header_labels] -> headers

for(i in 2:length(details)){

  try(seq(1,length(details[[i]]), by = 2) -> header_labels)

  try(details[[i]][header_labels] -> headers_1)

  try(headers = c(headers, headers_1))

}

headers %>% unique() %>% na.omit() %>% as.character() -> full_headers
#______________Create data frame with header names__________________

matrix(data = NA, nrow = nrow(df), ncol = length(full_headers)) %>%
  data.frame() -> Final_df

names(Final_df) = full_headers

#______________Populate data frame___________________________________

for(i in 1:length(details)){

  for(j in 1:length(full_headers)){

    v_header = details[[i]]

    sum(v_header == full_headers[j]) -> check

    if(check != 0){

      value = which(v_header == full_headers[j])

      if(length(value) > 1){value = value[1]}

      value = value + 1

      Final_df[i,full_headers[j]] = v_header[value]

      }

  }

}

#_______________Export Final File____________________________________
write.csv(Final_df, "Final_Details_File.csv", row.names = FALSE)
I had a tough time trying to understand what the hell is “html encoding”. Apparently, you can’t just scrape a foreign language website like you would one that’s in English. RSelenium gets the page source from a site as class character, so I just replaced all the Swedish special characters with English ones and only then did I use rvest for extracting the information that I needed. By the end of the script, i was left with 20 variables; some of which i don’t understand, and some of which are pretty straight forward. All variable names were translated from their original Swedish and since I don’t know the first thing about Swedish, i just used google translate. The variables are:
1. Link: The link to the actual post
2. meta: The meta data that includes the longitudes and latitudes, among other things.
3. Latitude: Latitudes isolated from meta data
4. Longitudes: Same as the latitudes
5. Property_Type: Pretty much self explanatory. It ranges from “Apartment”, to “Plot_Land”.
6. Rooms: The number of rooms in the property.
7. Living_Area: The figures are in square meters, and relate to only the living space in the property.
8. Flat_Floor: If the property is on a floor, the floor number.
9. Page_Views
10. Mobile_Coverage: I’m guessing this means the telecommunications company providing service in the area.
11. Estimate: The estimating price of the property., in SEK.
12. Estimate_Per_SqM: The price of per square meter of the living area.
13. Fee
14. Operating_Cost
15. Year_Built: The year the property was constructed.
16. Distance_from_Water: I was honestly curious about this one. Probably means the distance from a lake or an ocean…?
17. Plot: This is the total area of the property as a whole, not to be confused with the Living_Area variable. This is also in square meters.
18. Agency: The real estate agency who are arranging the transactions.
19. Price_Change: Any changes in the estimate hat was originally posted. Currency is in SEK.
20. Date_Modified: The date in which the post was modified.
There was one more variable that i managed to extract but i couldn’t translate from the original Swedish, so i just excluded it. I had to do all the translations manually in R when i was cleaning the data. The final data frame has roughly 24000 rows of data. The script i used for the data cleaning/tidying is below:
library(dplyr)
library(RSelenium)
library(rvest)
library(stringr)
library(beepr)

Final_Clean = Final_df

head(Final_Clean)

#_________________Rename Columns__________________________________________

new_headers = c("Property_Type", "Rooms", "Living_Area", "Flat_Floor_Number",
                 "Page_Views", "Mobile_Coverage", "Estimate", "Est_Sq_Met", "Fee",
                 "Operating_Cost", "Year_Built", "Distance_To_Water", "Plot",
                 "Biarea", "Agency", "Price_Change", "Modification_Date")

names(Final_Clean) = new_headers

#___________Separate All NA Rows_________________________________

NAs = c()
x = 0
for(i in 1:nrow(Final_Clean)){

  Final_Clean[i,] %>% is.na() %>% sum() -> Sum_NAs

  if(Sum_NAs == ncol(Final_Clean)){

    x = length(NAs) + 1

    NAs[x] = i}

}

cbind(df, Final_Clean) -> Final_Clean

Final_Clean[NAs,] -> Final_NAs

Final_Clean[-NAs,] -> Final_Clean

#_________________Property  Type________________________________________________

unique(Final_Clean$Property_Type) -> Types

replacements = c("Lagenhet" = "Apartment", "Villa" = "Villa", "Radhus" = "Townhouse", "Tomt/Mark" = "Plot_Land",
                  "Fritidshus" = "Vacation_Home", "Kedjehus" = "Detached_House", "GÃ¥rd" = "Farm", "Parhus" = "Townhouse",
                  "Ovrigt" = "Other")

replacements[Final_Clean$Property_Type] -> Final_Clean$Property_Type

#________________Rooms____________________________________________________________

unique(Final_Clean$Rooms) %>%
  na.omit() %>% as.character() -> Types

grepl("½", Types) -> log_Types

str_replace_all(Types, "½", replacement = "") %>%
  str_replace_all(pattern = "rum", replacement = "") %>%
  as.integer() -> Types_int

Types_int[log_Types] + 0.5 -> Types_int[log_Types]

setNames(Types_int, Types) %>% as.table() -> replacements

replacements[Final_Clean$Rooms] %>%
  as.numeric() -> Final_Clean$Rooms

#_______________Remove unwanted characters________________________________________

c("m²", " tr", " st", " kr/m²", " kr/mån", " kr", " ", "/") -> replacements

for(i in 5:ncol(Final_Clean)){

  for(j in 1:nrow(Final_Clean)){

    for(k in 1:length(replacements)){

      str_replace_all(Final_Clean[j,i],
                      pattern = replacements[k],
                      replacement = "") -> Final_Clean[j,i]
    }

  }

}

beep()
Sys.sleep(0.2)
beep()
Sys.sleep(0.2)

#_______________Standardize measurements for Distance to water______________________

Final_Clean$Distance_To_Water %>%
  str_replace_all(pattern = ",", replacement = "") -> Final_Clean$Distance_To_Water

grepl("km", Final_Clean$Distance_To_Water) -> loc_km

Final_Clean$Distance_To_Water %>%
  str_replace_all(pattern = "km", replacement = "") %>%
  str_replace_all(pattern = "m", replacement = "") %>%
  as.numeric() -> figures

Final_Clean$Distance_To_Water = figures

Final_Clean$Distance_To_Water[!loc_km] = figures[!loc_km]/1000

#_______________changes to appropriate classes_______________________________________

names(Final_Clean) %>% as.data.frame()

for(i in c(3, 4,11, 12, 13, 14, 20)){

  Final_Clean[,i] = as.numeric(Final_Clean[,i])

}

for(i in c(6, 7, 8, 9, 15, 17)){

  Final_Clean[,i] = as.integer(Final_Clean[,i])

}

for(i in c(5, 10, 19)){

  Final_Clean[,i] = as.factor(Final_Clean[,i])

}

#check
str(Final_Clean)
Alright, now that i have the data, time to somehow get a hold of a map of Sweden and plot the data on the map.
I hate this part, because other than my previous post about plotting Manhattan rentals; i don’t know the first thing about geographic files/data.
It took me a while to find a reasonably simple file. The first file i got was from the European Environment Agency. The file was just too gigantic for me to load onto R. I’m embarrassed to say that my feeble desktop PC actually crashed trying to load this. Tried on my laptop, and it quite literally took an entire day for the load process to finish.
Luckily i found the one that was put up on the Global Administrative Areas site. You just need to select the country, and then pick one of the download links provided.
Now that i have all the information i need, time for some plots.


Yeah. That second plot doesn’t look as insightful as i was hoping it would be. It looks like the Apartment levels seem to have distorted the scale of the density. I’m guessing that’s why the other property types all show light shades of green and no red.
Probably more useful to check the average prices of each Property Type…
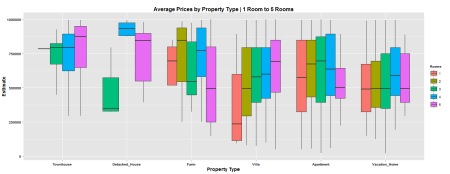
I expected the Villa to have the highest average, but to be honest…i don’t know the difference between a Townhouse and a Villa. I limited the dataset by filtering only Estimates of SEK 1M or less, and Rooms 5 or less. The Villa category seems to be the only Property Type that shows a logical progression of Estimate VS number of Rooms. I couldn’t figure out how to somehow map the year in which the property was built, so instead I tried to plot the locations of all the posts, and map the colors by how expensive the property is.

Yeah. That, also, was not as visually pleasing as I thought it would be. Plus, I couldn’t figure out how to plot the Rooms variables somehow.
Anywho, there’s not much I can do with all this data, mainly because my R game is not as good as I would like it to be – still need an awful lot of work. But if anyone out there would like to get their hands on the data, let me know and I’ll send you a copy.
R-bloggers.com offers daily e-mail updates about R news and tutorials about learning R and many other topics. Click here if you're looking to post or find an R/data-science job.
Want to share your content on R-bloggers? click here if you have a blog, or here if you don't.