
How to create a Twitter Sentiment Analysis using R and Shiny
Want to share your content on R-bloggers? click here if you have a blog, or here if you don't.
Everytime you release a product or service you want to receive feedback from users so you know what they like and what they don’t. Sentiment Analysis can help you. I will show you how to create a simple application in R and Shiny to perform Twitter Sentiment Analysis in real-time. I use RStudio.
We will be able to see if they liked our products or not. Also, we will create a wordcloud to find out why they liked it and why not.
First, I will create a Shiny Project. To learn how to create a Shiny apps you might read this tutorial by Teja Kodali and another tutorial by Aaron Gowins.
Then, in the ui.R file, I put this code:
shinyUI(fluidPage(
titlePanel("Sentiment Analysis"), #Title
textOutput("currentTime"),   #Here, I show a real time clock
h4("Tweets:"),   #Sidebar title
sidebarLayout(
sidebarPanel(
dataTableOutput('tweets_table') #Here I show the users and the sentiment
),
Show a plot of the generated distribution:
mainPanel(
plotOutput("distPlot"), #Here I will show the bars graph
sidebarPanel(
plotOutput("positive_wordcloud") #Cloud for positive words
),
sidebarPanel(
plotOutput("negative_wordcloud") #Cloud for negative words
),
sidebarPanel(
plotOutput("neutral_wordcloud") #Cloud for neutral words
)))))
Here, I will show a title, the current time, a table with Twitter user name, a bar graph and wordclouds. Also you have to put your consumer key and secret (replace xxxxxxxxxx). You will have to create and application in Twitter Developers site and then extract this info.
Now, I will create the server side:
library(shiny)
library(tm)
library(wordcloud)
library(twitteR)
shinyServer(function(input, output, session) {
setup_twitter_oauth(consumer_key = "xxxxxxxxxxxx", consumer_secret = "xxxxxxxxxxxx")
token <- get("oauth_token", twitteR:::oauth_cache) #Save the credentials info
token$cache()
output$currentTime <- renderText({invalidateLater(1000, session) #Here I will show the current time
paste("Current time is: ",Sys.time())})
observe({
invalidateLater(60000,session)
count_positive = 0
count_negative = 0
count_neutral = 0
positive_text <- vector()
negative_text <- vector()
neutral_text <- vector()
vector_users <- vector()
vector_sentiments <- vector()
tweets_result = ""
tweets_result = searchTwitter("word-or-expression-to-evaluate") #Here I use the searchTwitter function to extract the tweets
for (tweet in tweets_result){
print(paste(tweet$screenName, ":", tweet$text))
vector_users <- c(vector_users, as.character(tweet$screenName)); #save the user name
if (grepl("I love it", tweet$text, ignore.case = TRUE) == TRUE | grepl("Wonderful", tweet$text, ignore.case = TRUE) | grepl("Awesome", tweet$text, ignore.case = TRUE)){ #if positive words match...
count_positive = count_positive + 1 # Add the positive counts
vector_sentiments <- c(vector_sentiments, "Positive") #Add the positive sentiment
positive_text <- c(positive_text, as.character(tweet$text)) # Add the positive text
} else if (grepl("Boring", tweet$text, ignore.case = TRUE) | grepl("I'm sleeping", tweet$text, ignore.case = TRUE)) { # Do the same for negatives
count_negative = count_negative + 1
vector_sentiments <- c(vector_sentiments, "Negative")
negative_text <- c(negative_text, as.character(tweet$text))
} else { #Do the same for neutrals
count_neutral = count_neutral + 1
print("neutral")
vector_sentiments <- c(vector_sentiments, "Neutral")
neutral_text <- c(neutral_text, as.character(neutral_text))
}
}
df_users_sentiment <- data.frame(vector_users, vector_sentiments)
output$tweets_table = renderDataTable({
      df_users_sentiment
    })
    output$distPlot  0){
        output$positive_wordcloud  0) {
        output$negative_wordcloud  0){
        output$neutral_wordcloud <- renderPlot({ wordcloud(paste(neutral_text, collapse=" "), min.freq = 0, random.color=TRUE , max.words=100 ,colors=brewer.pal(8, "Dark2"))  })
      }
    })
  })
})
})
Here a screenshot of the shiny app we created:
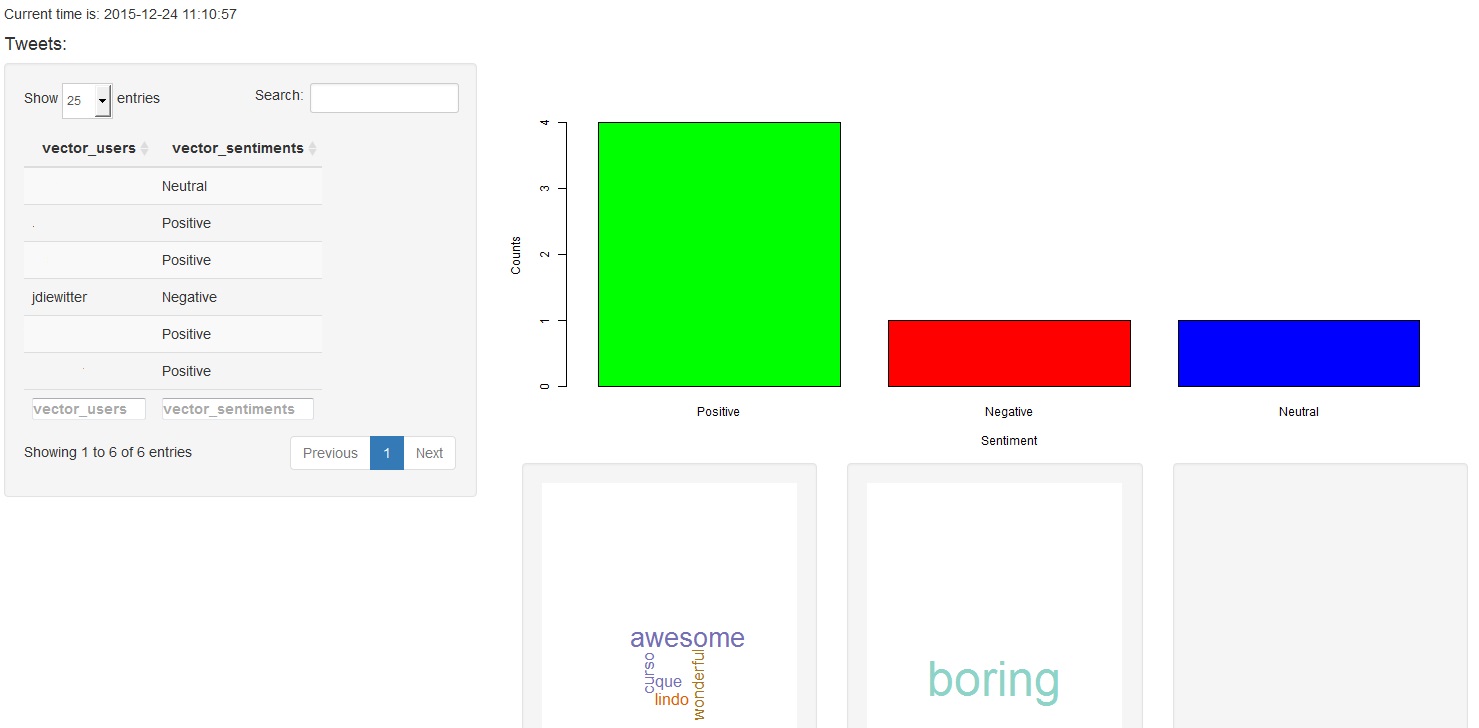
It’s a really simply code, not complex at all. The purpose of it is just for testing and so you guys can practice R language. If you have questions just let me know.
R-bloggers.com offers daily e-mail updates about R news and tutorials about learning R and many other topics. Click here if you're looking to post or find an R/data-science job.
Want to share your content on R-bloggers? click here if you have a blog, or here if you don't.