January 2015

Revolution Analytics joins Microsoft

January 23, 2015 | David Smith

by David Smith, Chief Community Officer On behalf of the entire Revolution Analytics team I am excited to announce that Revolution Analytics is joining forces with Microsoft to bring R to even more enterprises. Microsoft announced today that it will acquire Revolution Analytics. Now, Microsoft might seem like a strange ... [Read more...]

R Package to Download Fitbit Data

January 22, 2015 | Cory Nissen

Fitbit is a device that tracks your daily activity. It's basically a pedometer, but it does a little more. It has an altimeter, so it can count flight of stairs climbed. It can detect your sleeping activity and give you a read on how often you are tossing and turning. ... [Read more...]

A first look at Spark

January 22, 2015 | Joseph Rickert

by Joseph Rickert Apache Spark, the open-source, cluster computing framework originally developed in the AMPLab at UC Berkeley and now championed by Databricks is rapidly moving from the bleeding edge of data science to the mainstream. Interest in Spark, demand for training and overall hype is on a trajectory to ... [Read more...]

Data Wrangling Webinar and IFAR Chapter Update

January 22, 2015 | dogle

A week or so ago I participated in the “Data Wrangling” webinar provided by RStudio.  I found Garret Gromelund’s descriptions of the functions in tidyr and dplyr to be fantastic.  A recording of the webinar is available here on the RStudio … Continue reading → [Read more...]

Sequential Monte Carlo 2015 workshop

January 22, 2015 | xi'an

An announcement for the SMC 2015 workshop: Sequential Monte Carlo methods (also known as particle filters) have revolutionized the on-line and off-line analysis of data in fields as diverse as target tracking, computer vision, financial modelling, brain imagery, or population ecology. Their popularity stems from the fact that they have made ...
[Read more...]

Four Famous Laws & How You Can Visualize Them

January 22, 2015 | Plotly

Famous laws, theorems, and observations are often named after the person who proposed the idea. These “eponymous laws" can be graphed. We do so in this post, using our free, web-based product. Contact us about getting a trial of Plotly Enterprise on your servers. Moore’s Law Transistors are used ... [Read more...]

Easy error propagation in R

January 22, 2015 | Lee Pang

In a previous post I demonstrated how to use R’s simple built-in symbolic engine to generate Jacobian and (pseudo)-Hessian matrices that make non-linear optimization perform much more efficiently. Another related application is Gaussian error propagation. Say you have data from a set of measurements in variables x and ... [Read more...]

Dilma e Aécio no Facebook

January 21, 2015 | Tiago Dantas

Pensando no Aécio Neves e na Dilma Rousseff, fiz um gráfico usando o R e a API do Facebook. Desde o fim das eleições, o Slogan do Aécio Neves tem sido ‪#‎nãovamosnosdispersar‬. Bom, a frase é interessante mas parece que o político precisa de uma ... [Read more...]

Practical introduction to Shiny – workshop write-up

January 21, 2015 | Robin Lovelace - R

I recently delivered a workshop on a practical introduction to shiny, an R package that enables development, testing and deployment of interactive web applications. Delivered at the University of Sydney’s Institute for Transport and Logistics Studies (ITLS), it was designed for people who are a) fairly new to R (... [Read more...]

A beautiful story about NYC weather

January 21, 2015 | David Smith

Inspired by Tufte's classic visualization of New York City weather in 2013, Alex Bresler used the R language to update the chart for 2014: (Click the image to view the zoomable SVG version.) The R code to create the plot is available on GitHub, and is easily adapted to display data for ... [Read more...]

FOMC Dates – Full History Web Scrape

January 21, 2015 | Peter Chan

As I delve into the existing academic research regarding price patterns around US Federal Open Market Committee (FOMC) meetings, it’s clear that I will need more data than I collected in the previous post FOMC Dates - Scraping Data From Web Pages.Which reminds me of the quote by ... [Read more...]

Contraceptive Choice in Indonesia

January 20, 2015 | inkhorn82

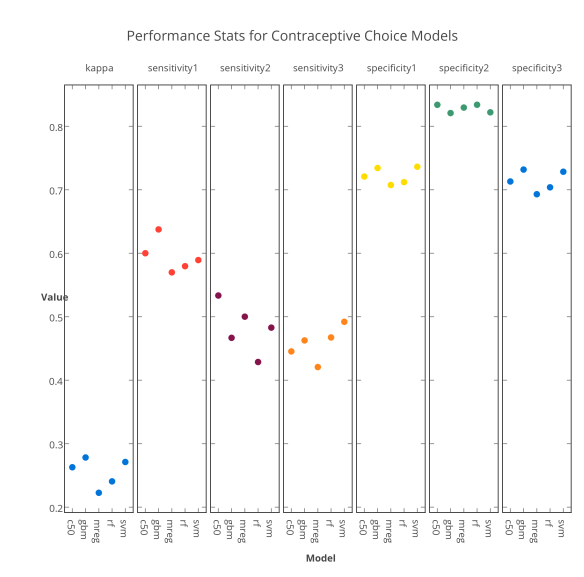
I wanted yet another opportunity to get to use the fabulous caret package, but also to finally give plot.ly a try.  To scratch both itches, I dipped into the UCI machine learning library yet again and came up with a … Continue reading →
[Read more...]

Visualizing bivariate shrinkage

January 20, 2015 | Maxwell B. Joseph

Inspired by this post about visualizing shrinkage on Coppelia, and this thread about visualizing mixed models on Stack Exchange, I started thinking about how to visualize shrinkage in more than one dimension. One might find themselves in this situation with a varying slope, varying intercept hierarichical (mixed effects) model, a ... [Read more...]

New Introductory R Course for Health Analytics

January 20, 2015 | Joseph Rickert

by Bob Horton, Data Scientist, Revolution Analytics From electronic medical records to genomic sequences, the data deluge is affecting all aspects of health care. The Masters of Science in Health Informatics (MSHI) program at the University of San Francisco, now in its second year, is designed to help students develop ... [Read more...]
1 2 3 4 5 6 12

Never miss an update!
Subscribe to R-bloggers to receive
e-mails with the latest R posts.
(You will not see this message again.)

Click here to close (This popup will not appear again)