
Setting Axis Limits on ggplot Charts
[This article was first published on OUseful.Info, the blog... » Rstats, and kindly contributed to R-bloggers]. (You can report issue about the content on this page here)
Want to share your content on R-bloggers? click here if you have a blog, or here if you don't.
Want to share your content on R-bloggers? click here if you have a blog, or here if you don't.
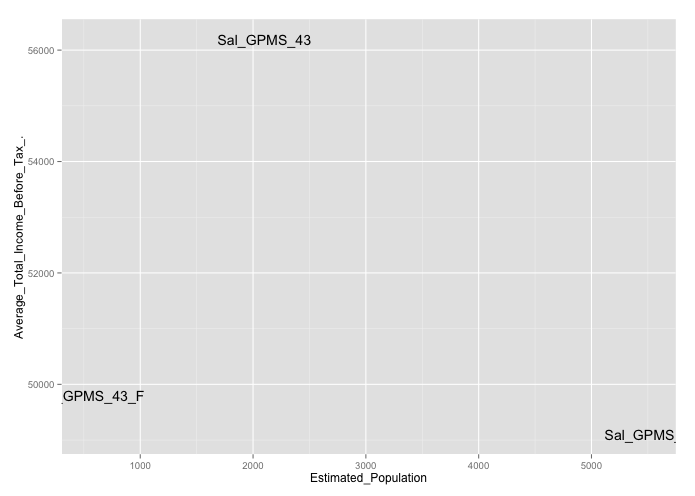
I’ve been doodling some chart in R/ggplot using geom_text() to generate a labelled scatterplot.
The chart actually builds up several layers using different datasets, so it’s not obvious how to set the ranges cleanly: I know the lower bound I want for the y-axis (y=0), but I want to let the upper bound float.
There’s also an issue with the labels overflowing the edges left and right.
So here are a couple of lines to make everything better (chart is in g):
#Find the current ymax value for upper bound
#(via http://stackoverflow.com/questions/7705345/how-can-i-extract-plot-axes-ranges-for-a-ggplot2-object#comment24184444_8167461 )
gy=ggplot_build(g)$panel$ranges[[1]]$y.range[2]
g=g+ylim(0,gy)

#Handle the overflow by expanding the x-axis
g=g+scale_x_continuous(expand=c(0.1,0))


To leave a comment for the author, please follow the link and comment on their blog: OUseful.Info, the blog... » Rstats.
R-bloggers.com offers daily e-mail updates about R news and tutorials about learning R and many other topics. Click here if you're looking to post or find an R/data-science job.
Want to share your content on R-bloggers? click here if you have a blog, or here if you don't.