How do Dew and Fog Form? Nature at Work with Temperature, Vapour Pressure, and Partial Pressure
Want to share your content on R-bloggers? click here if you have a blog, or here if you don't.
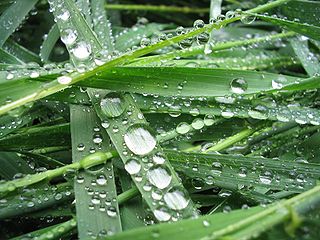
In the early morning, especially here in Canada, I often see dew – water droplets formed by the condensation of water vapour on outside surfaces, like windows, car roofs, and leaves of trees. I also sometimes see fog – water droplets or ice crystals that are suspended in air and often blocking visibility at great distances. Have you ever wondered how they form? It turns out that partial pressure, vapour pressure and temperature are the key phenomena at work.
Dew (by Staffan Enbom) and Fog (by Jon Zander)
Source: Wikimedia
Partial Pressure
The concept of partial pressure arises in gas mixtures. Atmospheric air is an example of a gas mixture; in an earlier post, I mentioned how Lord Rayleigh and William Ramsay isolated nitrogen from air and accidentally discovered argon. Air consists of mostly nitrogen and oxygen, but it also has small amounts of other gases, like water vapour, argon and carbon dioxide. From our physics classes, we learned that pressure is force per unit area. If a gas is stored in a container, then its particles will exert forces when they collide against the container’s walls, so the pressure of the gas is the sum of the forces per unit area of the container’s walls. According to the ideal gas law, the pressure of an ideal gas can be calculated by
,
where
– P = pressure
– n = number of gas particles (in moles)
– R = universal gas constant
– T = temperature
– V = volume
The partial pressure of a constituent gas in a gas mixture is the pressure that would be exerted by the constituent gas if it were the only gas in the container. According to Dalton’s law of partial pressures, the total pressure of the gas mixture is just the sum of all of the partial pressures of the constituent gases.
Returning to our earlier example of the atmosphere, atmospheric pressure is the pressure that atmospheric air exerts on the Earth’s surface. One of the constituent gases in atmospheric air is water vapour, which exerts a partial pressure that I’ll denote as .
Vapour Pressure
A gas can be converted to a liquid via condensation, and a liquid can be converted to a gas via evaporation. When the rate of evaporation equals the rate of condensation in a system containing a gas, the system has reached a state of dynamic equilibrium. It is dynamic because evaporation and condensation continue to occur, but the net number of particles exchanged between the 2 phases is zero – since it is at equilibrium. Thus, if any more of the gas is introduced to the system at dynamic equilibrium, it will be converted to a liquid. At dynamic equilibrium, the pressure of a gas exerting on its condensed phase at a given temperature has a special name: vapour pressure (vp).
Relative Humidity
You probably have an intuitive idea of humidity is, especially on a very hot and humid day, like what I experience in the summer here in Toronto. The air feels moist, and the heat feels oppressive, especially since our sweat doesn’t evaporate easily. Rigorously, relative humidity is defined as partial pressure of water as a percentage of the vapour pressure of water at a given temperature.
The Formation of Dew and Fog
Recall from the Ideal Gas Law that the pressure of a gas depends on its temperature. Thus, the vapour pressure of water varies at different temperatures. The decrease in temperature of atmospheric air is the cause of dew and fog formation. At high relative humidity, water will begin to condense as the temperature of the air drops. This often happens overnight, resulting in dew formation. This will also happen when warm air from above an ocean or a sea moves inland and cools, resulting in fog formation.
An Exercise – with a Possible Error
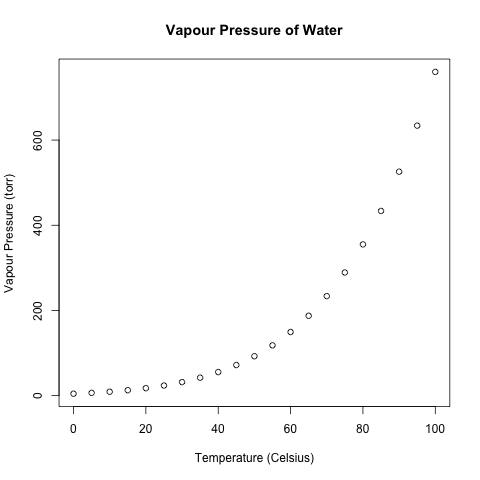
On Pages 225-226 of the 3rd “Chemistry” by John Olmsted III and Gregory Williams, Example 5-15 asks for the highest temperature at which fog could form from air that is at 65% relative humidity when the temperature is 27.5 degrees Celsius. To answer this question, one needs the vapour pressures of water a various temperatures, which are given on Page 224. I will reproduce these data and plot them in R.
                Temperature (Celsius)      Vapour Pressure (torr)
 [1,]                     0                  4.579
 [2,]                     5                  6.543
 [3,]                    10                  9.209
 [4,]                    15                 12.788
 [5,]                    20                 17.535
 [6,]                    25                 23.756
 [7,]                    30                 31.824
 [8,]                    35                 42.175
 [9,]                    40                 55.324
[10,]                    45                 71.880
[11,]                    50                 92.510
[12,]                    55                118.040
[13,]                    60                149.380
[14,]                    65                187.540
[15,]                    70                233.700
[16,]                    75                289.100
[17,]                    80                355.100
[18,]                    85                433.600
[19,]                    90                525.760
[20,]                    95                633.900
[21,]                   100                760.000
There is no vapour pressure given at 27.5 degrees Celsius, so the authors interpolate it by averaging the vapour pressures at 25 and 30 degrees Celsius, seeing how 27.5 is half-way between 25 and 30. However, as the above plot shows, the relationship is not linear, and averaging assumes a linear relationship, so the authors’ method is not very good.
(The lack of a linear relationship between temperature and water’s vapour pressure is troubling, since the ideal gas law predicts that the relationship is linear. Perhaps this deviation from linearity is due to water vapour in atmospheric air not meeting the assumptions of the ideal gas law.)
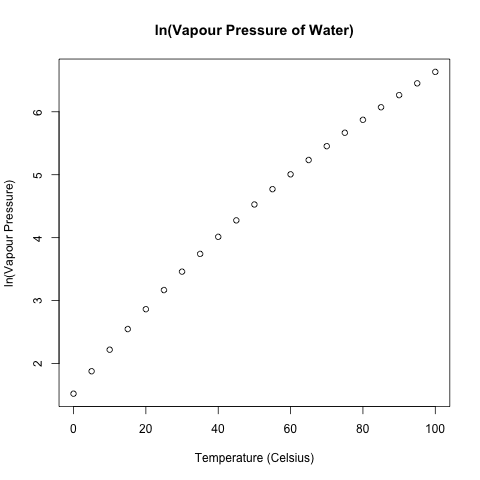
Akin to what I did last week with the exponential decay of DDT in trout, I log-transformed this data to get a more linear fit.
Using linear regression with the log-transformed data, I calculated the water vapour at 27.5 degrees Celsius by exponentiating the predicted target as calculated with the estimated regression coefficients.
> regression = lm(ln.vapour.pressure~temperature)
> regression

Call:
lm(formula = ln.vapour.pressure ~ temperature)

Coefficients:
(Intercept)  temperature
    1.83443      0.05059

> vapour.pressure.predicted = exp(1.83443 + 0.05059*27.5)
> vapour.pressure.predicted
[1] 25.17006
This is more than 2 degrees lower than the averaged value of 27.790 that Olmsted and Williams calculated.
Using the definition of relative humidity and my estimated vapour pressure of water from linear regression, the partial pressure of water at 65% relative humidity at 27.5 degrees Celsius is calculated to be 16.36054 torr.
Now, to find the temperature at which fog will form, we need to find the vapour pressure matching this partial pressure. Some calculations using the estimated regression coefficients reveal that this temperature is 18.98483 degrees, which is about 1 degree lower than Olmsted’s and William’s answer.
> (log(16.36054)-1.83443)/0.05059
[1] 18.98483
At 18.98483 degrees Celsius or lower, fog will form.
Filed under: Applied Statistics, Basic Chemistry, Physical Chemistry, Plots, R programming Tagged: basic chemistry, chemistry, data, data analysis, data visualization, dew, fog, humidity, linear regression, logarithmic transformation, partial pressure, physical chemistry, plot, plots, plotting, pressure, R, R programming, regression, relative humidity, temperature, vapor, vapor pressure, vapour, vapour pressure, water, water vapor, water vapour
R-bloggers.com offers daily e-mail updates about R news and tutorials about learning R and many other topics. Click here if you're looking to post or find an R/data-science job.
Want to share your content on R-bloggers? click here if you have a blog, or here if you don't.


