
Bayesian Models with Censored Data: A comparison of OLS, tobit and bayesian models
[This article was first published on Econometric Sense, and kindly contributed to R-bloggers]. (You can report issue about the content on this page here)
Want to share your content on R-bloggers? click here if you have a blog, or here if you don't.
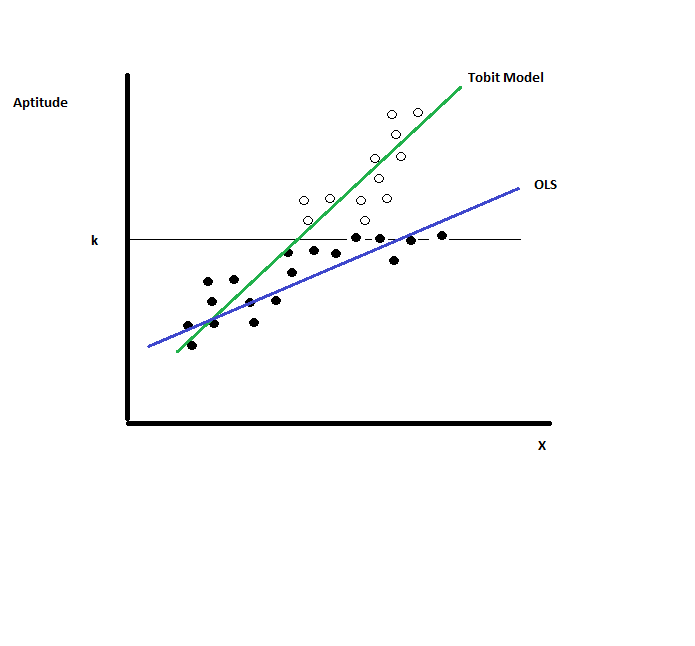
The following R code models a censored dependent variable (in this case academic aptitude) using a traditional least squares, tobit, and Bayesian approaches. As depicted below, the OLS estimates (blue) for censored data are inconsistent and will not approach the true population parameters (green).Want to share your content on R-bloggers? click here if you have a blog, or here if you don't.

Below is the output of a regression modeling academic aptitude (using data from UCLA statistical computing examples- see references in the R-code documentation that follows) as a function of reading and math scores, as well as program participation:
Call:
lm(formula = mydata$apt ~ mydata$read + mydata$math + as.factor(mydata$prog))
Residuals:
Min 1Q Median 3Q Max
-161.463 -42.474 -0.707 43.180 181.554
Coefficients:
Estimate Std. Error t value Pr(>|t|)
(Intercept) 242.735 30.140 8.054 7.80e-14 ***
mydata$read 2.553 0.583 4.379 1.95e-05 ***
mydata$math 5.383 0.659 8.169 3.84e-14 ***
as.factor(mydata$prog)general -13.741 11.744 -1.170 0.243423
as.factor(mydata$prog)vocational -48.835 12.982 -3.762 0.000223 ***
—
Signif. codes: 0 ‘***’ 0.001 ‘**’ 0.01 ‘*’ 0.05 ‘.’ 0.1 ‘ ’ 1
Residual standard error: 62.38 on 195 degrees of freedom
Multiple R-squared: 0.6127, Adjusted R-squared: 0.6048
F-statistic: 77.13 on 4 and 195 DF, p-value: < 2.2e-16
Below is output from a tobit model specified in R:
vglm(formula = mydata$apt ~ mydata$read + mydata$math + as.factor(mydata$prog),
family = tobit(Upper = 800))
Pearson Residuals:
Min 1Q Median 3Q Max
mu -3.2606 -0.69522 0.049445 0.82743 2.7935
log(sd) -1.1309 -0.61020 -0.310926 0.21836 4.8277
Coefficients:
Value Std. Error t value
(Intercept):1 209.5488 32.642056 6.4196
(Intercept):2 4.1848 0.049756 84.1071
mydata$read 2.6980 0.619577 4.3546
mydata$math 5.9148 0.706472 8.3723
as.factor(mydata$prog)general -12.7145 12.409533 -1.0246
as.factor(mydata$prog)vocational -46.1431 13.707785 -3.3662
Number of linear predictors: 2
Names of linear predictors: mu, log(sd)
Dispersion Parameter for tobit family: 1
Log-likelihood: -872.8971 on 394 degrees of freedom
Number of Iterations: 8
Notice the coefficients from the tobit model are larger than those from OLS, indicating the downward bias of the coefficients resulting from OLS regression on a censored dependent variable. Below is the output from a bayesian model, based on the specifications outlined for the MCMCtobit function in the MCMCpack documentation. These results are very similar to those obtained by the previous tobit model output.
Thinning interval = 1
Number of chains = 1
Sample size per chain = 30000
1. Empirical mean and standard deviation for each variable,
plus standard error of the mean:
Mean SD Naive SE Time-series SE
(Intercept) 208.635 33.3365 0.192468 0.213581
mydata$read 2.702 0.6304 0.003640 0.003506
mydata$math 5.930 0.7242 0.004181 0.004368
as.factor(mydata$prog)general -12.733 12.6756 0.073183 0.082116
as.factor(mydata$prog)vocational -46.145 13.9556 0.080573 0.085942
sigma2 4486.277 488.5388 2.820580 2.962118
2. Quantiles for each variable:
2.5% 25% 50% 75% 97.5%
(Intercept) 142.260 186.381 208.659 231.153 273.779
mydata$read 1.482 2.273 2.701 3.120 3.949
mydata$math 4.522 5.438 5.924 6.417 7.357
as.factor(mydata$prog)general -37.558 -21.261 -12.733 -4.175 12.300
as.factor(mydata$prog)vocational -73.634 -55.441 -46.044 -36.719 -18.890
sigma2 3635.560 4140.883 4450.761 4795.448 5536.943
R-Code: (use scroll bar at bottom, or click code and scroll with arrow keys)
#   ------------------------------------------------------------------

#  | PROGRAM NAME: ex_bayesian_tobit

#  | DATE: 9/17/11

#  | CREATED BY:  Matt Bogard

#  | PROJECT FILE: www.econometricsense.blogspot.com

#  |----------------------------------------------------------------

#  | PURPOSE: comparison of models for censored dependent variables

#  | 1 - least squares

#  | 2 - tobit model

#  | 3 - bayesian model

#  |------------------------------------------------------------------

#  | REFERENCES:

#  | UCLA Statistical Computing: http://www.ats.ucla.edu/stat/R/dae/tobit.htm

#  | R Package 'MCMCpack' documentation : # http://mcmcpack.wustl.edu/documentation.html

#  |

#  | Literature:

#  |   Andrew D. Martin, Kevin M. Quinn, and Jong Hee Park. 2011. “MCMCpack: Markov Chain Monte Carlo in R.”,

#  |   Journal of Statistical Software. 42(9): 1-21. http://www.jstatsoft. org/v42/i09/.

#  |

#  |   Daniel Pemstein, Kevin M. Quinn, and Andrew D. Martin. 2007. Scythe Statistical Library 1.0.

#  |   http://  scythe.wustl.edu.

#  |

#  |   Martyn Plummer, Nicky Best, Kate Cowles, and Karen Vines. 2002. Output Analysis and Diagnos- tics for

#  |   MCMC(CODA). http://www-fis.iarc.fr/coda/.

#  |

#  |  Siddhartha Chib. 1992. “Bayes inference in the Tobit censored regression model." Journal of Econometrics. #  |  51:79-99.

#  |

#  |

#  |

#   ------------------------------------------------------------------


# example tobit model


# get data


mydata <- read.csv(url("http://www.ats.ucla.edu/stat/r/dae/tobit.csv"))


#explore dataset

names(mydata) # list var names

dim(mydata) # data dimensions

hist(mydata$apt)  # histogram of dependent variable for academic aptitude

                          #  indcates right or upper bound censoring at 'y' = 800


# run model using standard ols regression


ols <- lm(mydata$apt~mydata$read + mydata$math + as.factor(mydata$prog))


summary(ols)


#  tobit model


library(VGAM) # load package


tobit <- vglm(mydata$apt ~ mydata$read + mydata$math + as.factor(mydata$prog), tobit(Upper=800))


summary(tobit)


# note the coefficients for the tobit model are larger, indicating the downward bias

# of the OLS estimates


# bayesian model


library(MCMCpack) # load package


bayes.tobit <- MCMCtobit(mydata$apt ~ mydata$read + mydata$math + as.factor(mydata$prog), above = 800, mcmc = 30000, verbose = 1000)


summary(bayes.tobit)


plot(bayes.tobit)


# the empirical (posterior mean) looks very similar to the tobit estimates. To leave a comment for the author, please follow the link and comment on their blog: Econometric Sense.
R-bloggers.com offers daily e-mail updates about R news and tutorials about learning R and many other topics. Click here if you're looking to post or find an R/data-science job.
Want to share your content on R-bloggers? click here if you have a blog, or here if you don't.