
SWMPr 2.0.0 now on CRAN
Want to share your content on R-bloggers? click here if you have a blog, or here if you don't.
I’m pleased to announce that my second R package, SWMPr, has been posted on CRAN. I developed this package to work with water quality time series data from the System Wide Monitoring Program (SWMP) of the National Estuarine Research Reserve System (NERRS). SWMP was established in 1995 to provide continuous environmental data at over 300 fixed stations in 28 estuaries of the United States (more info here). SWMP data are collected with the general objective of describing dynamics of estuarine ecosystems to better inform coastal management. However, simple tools for processing and evaluating the increasing quantity of data provided by the monitoring network have complicated broad-scale comparisons between systems and, in some cases, simple trend analysis of water quality parameters at individual sites. The SWMPr package was developed to address common challenges of working with SWMP data by providing functions to retrieve, organize, and analyze environmental time series data.
The development version of this package lives on GitHub. It can be installed from CRAN and loaded in R as follows:
install.packages('SWMPr')
library(SWMPr)
SWMP data are maintained online by the Centralized Data Management Office (CDMO). Time series data describing water quality, nutrient, or weather observations can be downloaded for any of the 28 estuaries. Several functions are provided by the SWMPr package that allow import of data from CDMO into R, either through direct download through the existing web services or by local (import_local) or remote (import_remote) sources. Imported data are loaded as swmpr objects with several attributes following standard S3 object methods. The remaining functions in the package are used to organize and analyze the data using a mix of standard methods for time series and more specific approaches developed specifically for SWMP. This blog concludes with a brief summary of the available functions, organized by category. As always, be sure to consult the help documentation for more detailed information.
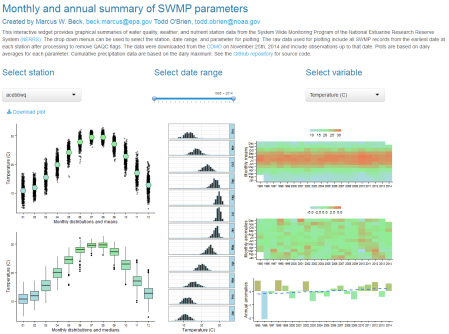
I’ve also created two shiny applications to illustrate the functionality provided by the package. The first shiny app evaluates trends in SWMP data within and between sites using an interactive map. Trends between reserves can be viewed using the map, whereas trends at individual sites can be viewed by clicking on a map location. The data presented on the map were imported and processed using the import_local, qaqc, and aggregate functions. The second app provides graphical summaries of water quality, weather, or nutrient data at individual stations using the plot_summary function. Data were also processed with the import_local, qaqc, and aggregate functions.
SWMP trends map (click to access):

SWMP summary map (click to access):
SWMPr functions
Below is a brief description of each function in the SWMPr package. I’m currently working on a manuscript to describe use of the package in much greater detail. For now, please visit our website that introduced version 1.0.0 of the SWMPr package (check the modules tab).
Retrieve
all_params |
Retrieve up to 100 records starting with the most recent at a given station, all parameters. Wrapper to exportAllParamsXMLNew function on web services. |
all_params_dtrng |
Retrieve records of all parameters within a given date range for a station. Optional argument for a single parameter. Maximum of 1000 records. Wrapper to exportAllParamsDateRangeXMLNew. |
import_local |
Import files from a local path. The files must be in a specific format, specifically those returned from the CDMO using the zip downloads option for a reserve. |
import_remote |
Import SWMP site data from a remote independent server. These files have been downloaded from CDMO, processed using functions in this package, and uploaded to an Amazon server for quicker import into R. |
single_param |
Retrieve up to 100 records for a single parameter starting with the most recent at a given station. Wrapper to exportSingleParamXMLNew function on web services. |
Organize
comb.swmpr |
Combines swmpr objects to a common time series using setstep, such as combining the weather, nutrients, and water quality data for a single station. Only different data types can be combined. |
qaqc.swmpr |
Remove QAQC columns and remove data based on QAQC flag values for a swmpr object. Only applies if QAQC columns are present. |
qaqcchk.swmpr |
View a summary of the number of observations in a swmpr object that are assigned to different QAQC flags used by CDMO. The output is used to inform further processing but is not used explicitly. |
rem_reps.swmpr |
Remove replicate nutrient data that occur on the same day. The default is to average replicates. |
setstep.swmpr |
Format data from a swmpr object to a continuous time series at a given timestep. The function is used in comb.swmpr and can also be used with individual stations. |
subset.swmpr |
Subset by dates and/or columns for a swmpr object. This is a method passed to the generic `subset’ function provided in the base package. |
Analyze
aggreswmp.swmpr |
Aggregate swmpr objects for different time periods – years, quarters, months, weeks, days, or hours. Aggregation function is user-supplied but defaults to mean. |
aggremetab.swmpr |
Aggregate metabolism data from a swmpr object. This is primarily used within plot_metab but may be useful for simple summaries of raw daily data. |
ecometab.swmpr |
Estimate ecosystem metabolism for a combined water quality and weather dataset using the open-water method. |
decomp.swmpr |
Decompose a swmpr time series into trend, seasonal, and residual components. This is a simple wrapper to decompose. Decomposition of monthly or daily trends is possible. |
decomp_cj.swmpr |
Decompose a swmpr time series into grandmean, annual, seasonal, and events components. This is a simple wrapper to decompTs in the wq package. Only monthly decomposition is possible. |
hist.swmpr |
Plot a histogram for a swmpr object. |
lines.swmpr |
Add lines to an existing swmpr plot. |
na.approx.swmpr |
Linearly interpolate missing data (NA values) in a swmpr object. The maximum gap size that is interpolated is defined as a maximum number of records with missing data. |
plot.swmpr |
Plot a univariate time series for a swmpr object. The parameter name must be specified. |
plot_metab |
Plot ecosystem metabolism estimates after running ecometab on a swmpr object. |
plot_summary |
Create summary plots of seasonal/annual trends and anomalies for a water quality or weather parameter. |
smoother.swmpr |
Smooth swmpr objects with a moving window average. Window size and sides can be specified, passed to filter. |
Miscellaneous
calcKL |
Estimate the reaeration coefficient for air-sea gas exchange. This is only used within the ecometab function. |
map_reserve |
Create a map of all stations in a reserve using the ggmap package. |
metab_day |
Identify the metabolic day for each approximate 24 period in an hourly time series. This is only used within the ecometab function. |
param_names |
Returns column names as a list for the parameter type(s) (nutrients, weather, or water quality). Includes QAQC columns with ‘f_’ prefix. Used internally in other functions. |
parser |
Parses html returned from CDMO web services, used internally in retrieval functions. |
site_codes |
Metadata for all stations, wrapper to exportStationCodesXMLNew function on web services. |
site_codes_ind |
Metadata for all stations at a single site, wrapper to NERRFilterStationCodesXMLNew function on web services. |
swmpr |
Creates object of swmpr class, used internally in retrieval functions. |
time_vec |
Converts time vectors to POSIX objects with correct time zone for a site/station, used internally in retrieval functions. |
Cheers,
Marcus

R-bloggers.com offers daily e-mail updates about R news and tutorials about learning R and many other topics. Click here if you're looking to post or find an R/data-science job.
Want to share your content on R-bloggers? click here if you have a blog, or here if you don't.