
Migrating from SPSS to R #rstats
Want to share your content on R-bloggers? click here if you have a blog, or here if you don't.
Preface
I will every now and then post my experience with R, a package for statistical analyses. I try to show some solutions for common types of analyses or problems you are facing when you start working with R. These “tutorials” especially address people who are used to work with SPSS or maybe also Strata.
Since I myself am new to R, my solutions probably are not the most elegant ones! Thus, any feedback is welcome!
Summary
This post just shows how to properly import SPSS data and get access to data values, variable and value labels. We need this basics for later tutorials where I focus on proper graphical output.
Why R?
I recently started using the statistical package R to do my statistical analyses at work. We all have SPSS licences at work, but still I was interested in testing R for some reasons:
- It’s free and runs on Windows, Mac and Linux
- The amount of different statistical analyses / modeling
- The various possibilities of creating graphics (see, e.g., here, here or here)
Migration, step 1: Installation
First of all, R only provides a console for any input and output and has no GUI (graphical user interface). This is probably the most hindering reason for migrating from SPSS to R, because calculating cross tabs on the fly, for instance, is not as easy as in SPSS. So, the first step when you have downloaded R and want to use it is to download a nice editor for it, too.
I would recommend R Studio, because it’s also free, runs on Windows/Mac/Linux, it’s beautiful and supports much the work with R.
Migration, step 2: Importing (SPSS) data
Assuming that you already have a database in SPSS format, the first problem is how to import this data and get it working with R. The first step is quite easy. Load the foreign package and run the read.spss command:
require("foreign")

data.spss <- read.spss("database.sav", use.value.labels=FALSE)
This will return a data frame containing all data from the SPSS file. With simple commands you can plot e.g. the frequencies of variable categories:
hist(data.spss$e42dep, breaks=c(0:4), ylim=c(0,400))
This will result in:
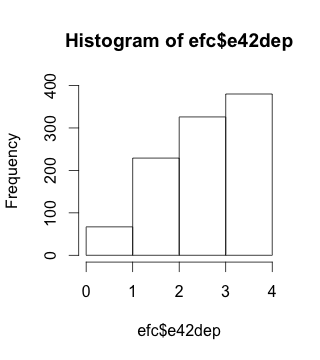
Here you can see one of the very annoying facts that, by default, outputs neither have a proper variable label nor the related value labels. And often many tutorials on how to import data end here, so the question remains: How can labels be imported and used as well?
Migration, step 3: Importing (SPSS) variable and value labels
Actually, importing labels is quite easy. You just don’t have to import the data as data frame, but convert the imported data to a data frame later. By this, you get all variable and value labels as attributes of the imported list and can access them like this:
require("foreign")

# load data base as list

efc.spss <- read.spss("database.sav", to.data.frame=FALSE, use.value.labels=FALSE)

# convert list to data frame

efc <- as.data.frame(efc.spss)

# copy all variable labels in separated list

efc_vars <- attr(efc.spss, "variable.labels")

# copy all value labels as separated list

efc_label <- attr(efc.spss, "label.table")
Now, a code plan is useful so you know the position of each variable in the dataset. For instance, the above used variable efc$e42dep is at position 86. This helps accessing the related labels.
Here an example of how to access each element:
# Getting the variable values

efc[,86]

# Getting the variable name, stored in the _vars-list

efc_vars[86]

# Getting the value labels, stored in the _labels-list

# remember to reverse the order, otherwise strings are assigned

# to labels in incorrect order

rev(attr(efc_label[[86]], "names"))
All you have to change is the index number of the variable (86) and replace it with any variable you need. Now you can plot a histogram with much more user friendly information:
hist(efc[,86], main=efc_vars[86], labels=rev(attr(efc_label[[86]], "names")), breaks=c(0:4), ylim=c(0,400), xlab=NULL, ylab=NULL)
which results in

This is still not the most beautiful plot ever, but you now know the basics of how to get variable and value labels of an imported SPSS dataset. In further tutorials I will show you my solutions on how to plot more beautiful diagrams in a very easy, fast way.
Tagged: Open Source, R, rstats, SPSS, Statistik

R-bloggers.com offers daily e-mail updates about R news and tutorials about learning R and many other topics. Click here if you're looking to post or find an R/data-science job.
Want to share your content on R-bloggers? click here if you have a blog, or here if you don't.