
How much code have you written?
Want to share your content on R-bloggers? click here if you have a blog, or here if you don't.
This past week I attended the National Water Quality Monitoring Conference in Cincinnati. Aside from spending my time attending talks, workshops, and meeting like-minded individuals, I spent an unhealthy amount of time in the hotel bar working on this blog post. My past experiences mixing coding and beer have suggested the two don’t mix, but I was partly successful in writing a function that will be the focus of this post.
I’ve often been curious how much code I’ve written over the years since most of my professional career has centered around using R in one form or another. In the name of ridiculous self-serving questions, I wrote a function for quantifying code lengths by file type. I would describe myself as somewhat of a hoarder with my code in that nothing ever gets deleted. Getting an idea of the total amount was a simple exercise in finding the files, enumerating the file contents, and displaying the results in a sensible manner.
I was not surprised that several functions in R already exist for searching for file paths in directory trees. The list.files function can be used to locate files using regular expression matching, whereas the file.info function can be used to get descriptive information for each file. I used both in my function to find files in a directory tree through recursive searching of paths with a given extension name. The date the files was last modified is saved, and the file length, as lines or number of characters, is saved after reading the file with readLines. The output is a data frame for each file with the file name, type, length, cumulative length by file type, and date. The results can be easily plotted, as shown below.
The function, obtained here, has the following arguments:
root |
Character string of root directory to search |
file_typs |
Character vector of file types to search, file types must be compatible with readLines |
omit_blank |
Logical indicating of blank lines are counted, default TRUE |
recursive |
Logical indicating if all directories within root are searched, default TRUE |
lns |
Logical indicating if lines in each file are counted, default TRUE, otherwise characters are counted |
trace |
Logical for monitoring progress, default TRUE |
Here’s an example using the function to search a local path on my computer.
# import function from Github
library(devtools)

# https://gist.github.com/fawda123/20688ace86604259de4e
source_gist('20688ace86604259de4e')

# path to search and file types
root <- 'C:/Projects'
file_typs <- c('r','py', 'tex', 'rnw')

# get data from function
my_fls <- file.lens(root, file_typs)

head(my_fls)

##                               fl Length       Date cum_len Type
## 1                 buffer loop.py     29 2010-08-12      29   py
## 2                  erase loop.py     22 2010-08-12      51   py
## 3 remove selection and rename.py     26 2010-08-16      77   py
## 4              composite loop.py     32 2010-08-18     109   py
## 5                extract loop.py     61 2010-08-18     170   py
## 6         classification loop.py     32 2010-08-19     202   py
In this example, I’ve searched for R, Python, LaTeX, and Sweave files in the directory ‘C:/Projects/’. The output from the function is shown using the head command.
Here’s some code for plotting the data. I’ve created four plots with ggplot and combined them using grid.arrange from the gridExtra package. The first plot shows the number of files by type, the second shows file length by date and type, the third shows a frequency distribution of file lengths by type, and the fourth shows a cumulative distribution of file lengths by type and date.
# plots
library(ggplot2)
library(gridExtra)

# number of files by type
p1 <- ggplot(my_fls, aes(x = Type, fill = Type)) +
	geom_bar() +
	ylab('Number of files') +
	theme_bw()

# file length by type and date
p2 <- ggplot(my_fls, aes(x = Date, y = Length, group = Type,
	colour = Type)) +
	geom_line() +
	ylab('File length') +
	geom_point() +
	theme_bw() +
	theme(legend.position = 'none')

# density of file length by type
p3 <- ggplot(my_fls, aes(x = Length, y = ..scaled.., group = Type,
	colour = Type, fill = Type)) +
	geom_density(alpha = 0.25, size = 1) +
	xlab('File length') +
	ylab('Density (scaled)') +
	theme_bw() +
	theme(legend.position = 'none')

# cumulative length by file type and date
p4 <- ggplot(my_fls, aes(x = Date, y = cum_len, group = Type,
	colour = Type)) +
	geom_line() +
	geom_point() +
	ylab('Cumulative file length') +
	theme_bw() +
	theme(legend.position = 'none')

# function for common legend
# https://github.com/hadley/ggplot2/wiki/Share-a-legend-between-two-ggplot2-graphs
g_legend<-function(a.gplot){
  tmp <- ggplot_gtable(ggplot_build(a.gplot))
  leg <- which(sapply(tmp$grobs, function(x) x$name) == "guide-box")
  legend <- tmp$grobs[[leg]]
  return(legend)}

# get common legend, remove from p1
mylegend <- g_legend(p1)
p1 <- p1 + theme(legend.position = 'none')

# final plot
grid.arrange(
	arrangeGrob(p1, p2, p3, p4, ncol = 2),
	mylegend,
	ncol = 2, widths = c(10,1))
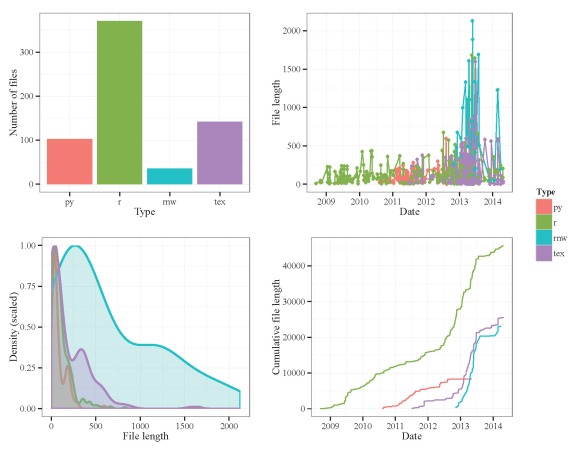
file.lens function. Number of lines per file is the unit of measurement.
Clearly, most of my work has been done in R, with most files being less than 200-300 lines. There seems to be a lull of activity in Mid 2013 after I finished my dissertation, which is entirely expected. I was surprised to see that the Sweave (.rnw) and LaTeX files weren’t longer until I remembered that paragraphs in these files are interpreted as single lines of text. I re-ran the function using characters as my unit of my measurement.
# get file lengths by character
my_fls <- file.lens(root, file_typs, lns = F)

# re-run plot functions above
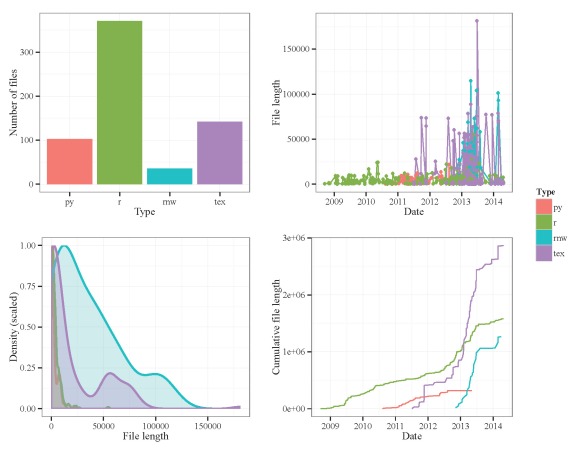
file.lens function. Number of characters per file is the unit of measurement.
Now there are clear differences in lengths for the Sweave and LaTeX files, with the longest file topping out at 181256 characters.
I know others might be curious to see how much code they’ve written so feel free to use/modify the function as needed. These figures represent all of my work, fruitful or not, in six years of graduate school. It goes without saying that all of your code has to be in the root directory. The totals will obviously be underestimates if you have code elsewhere, such as online. The function could be modified for online sources but I think I’m done for now.
Cheers,
Marcus

R-bloggers.com offers daily e-mail updates about R news and tutorials about learning R and many other topics. Click here if you're looking to post or find an R/data-science job.
Want to share your content on R-bloggers? click here if you have a blog, or here if you don't.