
How Microsoft Can Use Windows 8 to Dominate the Tech Industry
[This article was first published on Engaging Market Research, and kindly contributed to R-bloggers]. (You can report issue about the content on this page here)
Want to share your content on R-bloggers? click here if you have a blog, or here if you don't.
Windows 95 transformed the PC software market and established Microsoft as the dominant player. Can Microsoft do it again? Can it use the release of Windows 8 to elevate its entire brand image? More importantly to some of us, can Microsoft use statistical modeling to help it achieve its goal?Want to share your content on R-bloggers? click here if you have a blog, or here if you don't.
Of course, the answer depends on what you mean by brand image. But that is a more complicated issue that we can address in another post. For now, let’s agree on an operational definition and say that brand image is measured by a series of ratings or a checklist associating attributes or benefits with the brand. With this definition, brand image is the pattern of associations endorsed by customers. We can simplify the data collection even more by agreeing that our data will be brand image ratings, such as, “Windows 8 is for work and play.”
Companies, like Microsoft, with a product portfolio seek some degree of synergy from being able to provide a comprehensive solution rather than a single product. They want the “good” achieved with one product (e.g., Xbox Kinect) to transfer to the brand first and then filter out to the other products it offers (e.g., MS Office). Can statistical modeling help? Can we collect brand ratings from customers and model these connections between the product and the brand and then between the brand and other products?Getting concrete, if Windows 8 is seen as innovative, we would expect customers to assume a confirmation bias and begin to see all improvements in Microsoft products as additional instances of innovation. That is, customers begin to entertain the hypothesis that Microsoft is getting innovative. For example, you hear about the new “big data” capabilities in Excel 2013. Before Windows 8, this information may not have generalized to the Microsoft brand. But once the Microsoft “innovation bucket” is opened by Windows 8, every improvement for every product is added to the innovation reservoir and those product-brand-product connections start to be made. The distinction being proposed is between brand cohesion where all the products mutually reinforce the brand image and brand fragmentation where there is little synergy among the products in the portfolio.
To be clear, I am not suggesting that we ever ask customers to rate Microsoft. Brand image is a latent construct that cannot be directly measured. Of course, there is nothing to stop us from asking customers to rate Microsoft, but we have no idea what they are rating. Perhaps with a less well-known company with fewer products, we might believe that customers have no information except what they have learned from using the company’s products. But this is not the case with Microsoft. What are customers thinking about when they provide Microsoft ratings? We cannot just allow them to fill in the “blanks” and make their own decision about what to include under the Microsoft label. Do some respondents focus on the corporate side of Microsoft appearing in the news and the business reports? Are others thinking about productivity software, or the operating system, or email and internet explorer? Do gamers include Xbox? What products are businesses including under the Microsoft heading? And by businesses, do we mean owners, decision makers, or IT administers?No, we must ask the complete brand image battery for some subset of the different Microsoft products with which respondents are familiar. Then, we infer brand image by measuring agreement across products. If each Microsoft product is rated independently based only on the performance of that individual product, we will not see sizeable correlations across different products. On the other hand, between-product correlations will increase in size to the extent that the attribution is to the Microsoft brand and not the separate product (e.g., Excel is easy to use because Microsoft makes all its products easy to use”). We are calling this effect brand cohesion, and we are asking how Microsoft can use the release of Windows 8 to create greater cohesion among its products.
It’s the Response Pattern and Not Individual Ratings
We are going to be looking at a correlation matrix. Often we will be examining a very large correlation matrix with lots of ratings and lots of products. In order to keep it simple in this introduction, let us suppose that we asked respondents to rate three different Microsoft products on three different brand image items. This would yield a 9×9 correlation matrix. Can we see an underlying structure that would account for the pattern of correlations in this matrix?For example, if we observed a correlation matrix like the following one, we would conclude that there was no brand cohesion. The three ratings for the first Microsoft product, labeled A, are highly correlated at 0.64, as are the three ratings for Product B and the three ratings for Product C. But there is no correlation between the same ratings for the different products. Let the first rating be innovative. Whatever the rating of Product A’s innovation, it has no relationship with the innovation rating for Product B or C. We cannot see any brand cohesion for the Microsoft products because there is no relationship between the ratings for different products.
A1 | A2 | A3 | B1 | B2 | B3 | C1 | C2 | C3 | |
A1 | 1.00 | 0.64 | 0.64 | 0.00 | 0.00 | 0.00 | 0.00 | 0.00 | 0.00 |
A2 | 0.64 | 1.00 | 0.64 | 0.00 | 0.00 | 0.00 | 0.00 | 0.00 | 0.00 |
A3 | 0.64 | 0.64 | 1.00 | 0.00 | 0.00 | 0.00 | 0.00 | 0.00 | 0.00 |
B1 | 0.00 | 0.00 | 0.00 | 1.00 | 0.64 | 0.64 | 0.00 | 0.00 | 0.00 |
B2 | 0.00 | 0.00 | 0.00 | 0.64 | 1.00 | 0.64 | 0.00 | 0.00 | 0.00 |
B3 | 0.00 | 0.00 | 0.00 | 0.64 | 0.64 | 1.00 | 0.00 | 0.00 | 0.00 |
C1 | 0.00 | 0.00 | 0.00 | 0.00 | 0.00 | 0.00 | 1.00 | 0.64 | 0.64 |
C2 | 0.00 | 0.00 | 0.00 | 0.00 | 0.00 | 0.00 | 0.64 | 1.00 | 0.64 |
C3 | 0.00 | 0.00 | 0.00 | 0.00 | 0.00 | 0.00 | 0.64 | 0.64 | 1.00 |
A second hypothetical correlation matrix, shown below, looks a lot more like what we typically see in brand image research. The within-product correlations (in the boxes along the diagonal) are uniformly higher than the other correlations. Product C has the highest values with r values of 0.77, 0.72, and 0.69. The other two products also have substantial within-product correlations. We also want to look at the correlations among the same rating across different products. In order to see these values in the correlation matrix, I have used different colors. Only the ratings for the first attribute (A1, B1, and C1) are uniformly higher than the other correlations between different rating items for different products. These correlations are in red and have values of 0.48, 0.48 and 0.47.
A1 | A2 | A3 | B1 | B2 | B3 | C1 | C2 | C3 | |
A1 | 1.00 | 0.59 | 0.53 | 0.48 | 0.41 | 0.34 | 0.48 | 0.41 | 0.34 |
A2 | 0.59 | 1.00 | 0.49 | 0.41 | 0.35 | 0.29 | 0.41 | 0.35 | 0.29 |
A3 | 0.53 | 0.49 | 1.00 | 0.35 | 0.30 | 0.25 | 0.34 | 0.29 | 0.24 |
B1 | 0.48 | 0.41 | 0.35 | 1.00 | 0.67 | 0.61 | 0.47 | 0.40 | 0.33 |
B2 | 0.41 | 0.35 | 0.30 | 0.67 | 1.00 | 0.58 | 0.40 | 0.34 | 0.28 |
B3 | 0.34 | 0.29 | 0.25 | 0.61 | 0.58 | 1.00 | 0.33 | 0.28 | 0.24 |
C1 | 0.48 | 0.41 | 0.34 | 0.47 | 0.40 | 0.33 | 1.00 | 0.77 | 0.72 |
C2 | 0.41 | 0.35 | 0.29 | 0.40 | 0.34 | 0.28 | 0.77 | 1.00 | 0.69 |
C3 | 0.34 | 0.29 | 0.24 | 0.33 | 0.28 | 0.24 | 0.72 | 0.69 | 1.00 |
If you found the above description hard to follow, you are not alone. It is difficult to see the pattern even with a small 9×9 correlation matrix. Usually, we would run a factor analysis to uncover and display the underlying structure. Although everyone uses factor analysis now, much of the early work came from psychometricians studying intelligence. I note this only because we need to borrow another factor analytic model from psychometrics in order to separate the effects of brand and product.
Borrowing Some Statistical Tools from a Psychometric Neighbor
We can agree that there are just too many correlations to examine without a factor analytic model to uncover the underlying structure. But, the underlying structure that we are proposing has a very specific set of constraints. We need to run a bifactor model because we believe that these correlations are the outcome of two independent components: a general brand effect impacting all the ratings and separate more specific product effects isolated to each product. If you wish to learn more, I have written two earlier posts describing the bifactor model in more detail:Halo Effects and Multicollinearity: Separating the General from the Specific
Structural Equation Modeling: Separating the General from the Specific (Part II)
Hopefully, the following diagram will clear up any confusion.
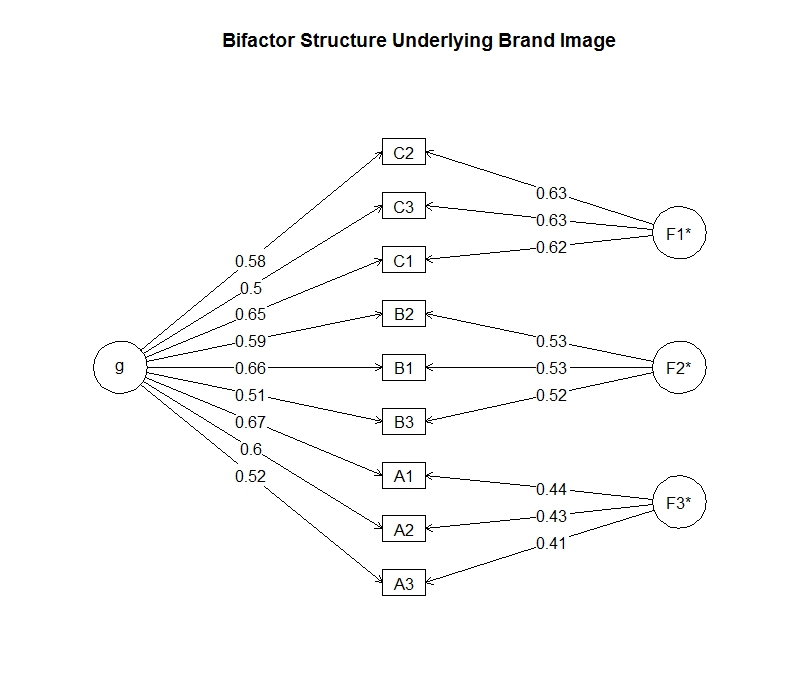
We can use the bifactor model to assess the contribution of the brand and the product to the observed correlations. These product specific paths account for some portion of the observed correlations within a product. For instance, the observed correlation between C2 and C3 is 0.69. The portion that is due to Product C is calculated by multiplying their path coefficients or 0.63 x 0.63 = 0.40. The remaining portion can be attributed to the general brand effect. Again, we multiply the path coefficients, this time from g, and find 0.58 x 0.50 = 0.29 due to the brand. Assuming a correct model specification, we have been able to decompose the observed 0.69 correlation between the two ratings into a 0.29 component from the brand and a 0.40 component from the product.
How can Microsoft use these findings to improve its brand image?
1. The path coefficients from the generalized brand latent variable (the g-coefficients) tell Microsoft if its brand image is cohesive or fragmented. The higher the coefficients we find, the more cohesive the brand. In our diagram we see g-coefficients ranging from 0.50 to 0.67. Like all factor analyses, these path coefficients are factor loadings (i.e., correlations between the latent brand variable and the observed ratings), and you are free to judge their magnitude as you would any other factor loading.
2. The path coefficients from each product latent variable provide Microsoft with similar information about the products. High product path coefficients indicate a cohesive product. It is not always the case that we find the high degree of product separation that we found in this example. Sometimes we have more or fewer latent variables than products. Many times there are multiple path coefficients heading into each rating item, and the diagram looks more like an entangled web rather than the nice separation we find in our diagram.
3. Finally, we can use the path coefficients to identify where Microsoft ought to concentrate its effort to improve its brand image. We are looking for product-specific image attributes that have strong connections to the general brand. The strategy is to change the perceptions of those product-specific attributes and have those improvements work their way back and enhance the brand image. Over time, the boosted brand image will encourage a more positive evaluation of all Microsoft products. This is synergy.
Summary: Using the bifactor model, we have been able to decompose the correlation matrix of customer ratings into brand and product components. The higher the path coefficients from the general brand latent variable, the more cohesive the brand. The higher the path coefficients from each separate product latent variable, the more cohesive the product. Thus, Microsoft products that are less integrated into the brand will have lower path coefficients from g. We do not see this pattern with this hypothetical data. The average of the path coefficients from g to each of the ratings is approximately the same for all three products.
However, we do see some differences in the g-coefficients for the three ratings. Across the three products, the first rating has the largest g-coefficient. If this first rating item measured innovation, for example, we would argue that innovation is more central to the brand image and where we might get our best return, all less being equal. That is, improving the innovation perception for Product C would work its way backward to the general brand perception and thus increase all the ratings for all the products proportional to their g-coefficients.Finally, you can see the advantages of using the bifactor modeling approach. We are able to make specific recommendations about individual ratings for each product in Microsoft’s portfolio. Where should Microsoft focus its efforts? They should focus on those ratings with the highest centrality – a measure from network analysis indicating the ability of that rating to have the most impact on the greatest number of other ratings.
Appendix (R code to run this analysis)
library(psych)

loadings <- matrix(c(
  .70, .40, .00, .00,
  .60, .43, .00, .00,
  .50, .45, .00, .00,
  .69, .00, .50, .00,
  .59, .00, .53, .00,
  .49, .00, .55, .00,
  .68, .00, .00, .60,
  .58, .00, .00, .63,
  .48, .00, .00, .65),
nrow=9,ncol=4, byrow=TRUE)

 cor_matrix<-loadings %*% t(loadings)
diag(cor_matrix)<-1
cor_matrix
R<-data.frame(cor_matrix)
names(R)<-c("A1","A2","A3","B1","B2","B3","C1","C2","C3")
R
m<-omega(R)
m
omega.diagram(m, digits=2, main="Bifactor Structure Underlying Brand Image")
To leave a comment for the author, please follow the link and comment on their blog: Engaging Market Research.
R-bloggers.com offers daily e-mail updates about R news and tutorials about learning R and many other topics. Click here if you're looking to post or find an R/data-science job.
Want to share your content on R-bloggers? click here if you have a blog, or here if you don't.