ggplot2: Changing the Default Order of Legend Labels and Stacking of Data
Want to share your content on R-bloggers? click here if you have a blog, or here if you don't.
“How to change the order of legend labels” is a question that gets asked relatively often on ggplot2 mailing list. A variation of this question is how to change the order of series in stacked bar/lineplots.
While these two questions seem to be related, in fact they are separate as the legend is controlled by scales, whereas stacking is controlled by the order of values in the data.
Recently I spent some time getting my head around this, and below is a quick recap.
Changing the Ordering of Legend Labels
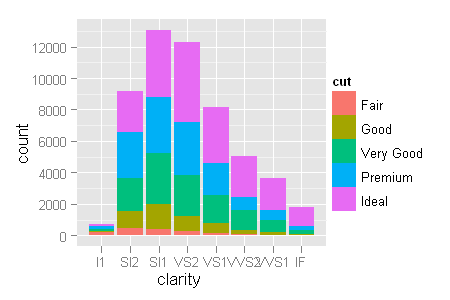
The standard stacked barplot looks like this:
> library(ggplot2) |
> ggplot(diamonds, aes(clarity, fill = cut)) + geom_bar() |

You notice that in the legend “Fair” is at the top and “Ideal” at the bottom. But what if I would like to order the labels in the reverse order, so that “Ideal” would be at the top?
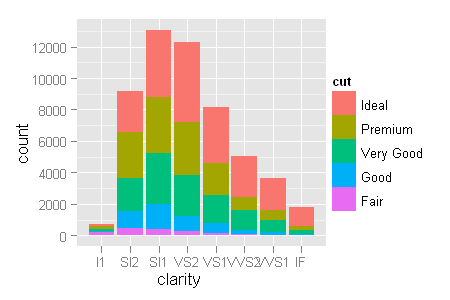
The order of legend labels can be manipulated by reordering the factor levels of the cut variable mapped to fill aesthetic.
> levels(diamonds$cut) [1] "Fair" "Good" "Very Good" "Premium" [5] "Ideal" > diamonds$cut <- factor(diamonds$cut, levels = rev(levels(diamonds$cut))) > levels(diamonds$cut) [1] "Ideal" "Premium" "Very Good" "Good" [5] "Fair" |
> ggplot(diamonds, aes(clarity, fill = cut)) + geom_bar() |

The legend entries are now in reverse order (and so is the stacking).
Changing Data Stacking Order
The order aesthetic changes the order in which the areas are stacked on top of each other.
The following aligns the order of both the labels and the stacking.
> ggplot(diamonds, aes(clarity, fill = cut, order = -as.numeric(cut))) + + geom_bar() |

Or, alternatively, reordering the factor levels again:
> diamonds$cut <- factor(diamonds$cut, levels = rev(levels(diamonds$cut))) > ggplot(diamonds, aes(clarity, fill = cut, order = -as.numeric(cut))) + + geom_bar() |

R-bloggers.com offers daily e-mail updates about R news and tutorials about learning R and many other topics. Click here if you're looking to post or find an R/data-science job.
Want to share your content on R-bloggers? click here if you have a blog, or here if you don't.
