
Flexibility of R Graphics
[This article was first published on Econometric Sense, and kindly contributed to R-bloggers]. (You can report issue about the content on this page here)
Want to share your content on R-bloggers? click here if you have a blog, or here if you don't.
(note scroll all the way down to see ‘old code’ and ‘new more flexible code’ Want to share your content on R-bloggers? click here if you have a blog, or here if you don't.
Recall and older post that presented overlapping density plots using R (Visualizing Agricultural Subsidies by KY County) see image below.

The code I used to produce this plot makes use of the rbind and data.frame functions (see below)
library(colorspace) # package for rainbow_hcl function
ds <- rbind(data.frame(dat=KyCropsAndSubsidies[,][,"LogAcres"], grp="All"),
data.frame(dat=KyCropsAndSubsidies[,][KyCropsAndSubsidies$subsidy_in_millions > 2.76,"LogAcres"], grp=">median"),
data.frame(dat=KyCropsAndSubsidies[,][KyCropsAndSubsidies$subsidy_in_millions <= 2.76,"LogAcres"], grp="<=median"))
# histogram and density for all ears
hs <- hist(ds[ds$grp=="All",1], main="", xlab="LogAcres", col="grey90", ylim=c(0, 25), breaks="fd", border=TRUE)
dens <- density(ds[ds$grp=="All",1], na.rm=TRUE)
rs <- max(hs$counts)/max(dens$y)
lines(dens$x, dens$y*rs, type="l", col=rainbow_hcl(3)[1])
# density for above median subsidies
dens <- density(ds[ds$grp==">median",1], na.rm=TRUE)
rs <- max(hs$counts)/max(dens$y)
lines(dens$x, dens$y*rs, type="l", col=rainbow_hcl(3)[2])
# density for below median subsidies
dens <- density(ds[ds$grp=="<=median",1], na.rm=TRUE)
rs <- max(hs$counts)/max(dens$y)
lines(dens$x, dens$y*rs, type="l", col=rainbow_hcl(3)[3])
# Add a rug to illustrate density.
rug(ds[ds$grp==">median", 1], col=rainbow_hcl(3)[2])
rug(ds[ds$grp=="<=median", 1], col=rainbow_hcl(3)[3])
# Add a legend to the plot.
legend("topright", c("All", ">median", "<=media"), bty="n", fill=rainbow_hcl(3))
# Add a title to the plot.
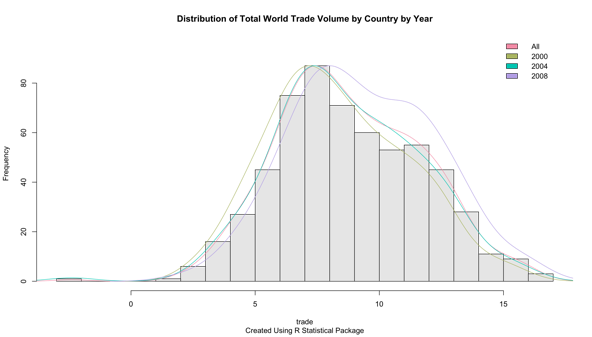
title(main="Distribution of Acres Planted by Subsidies Recieved Above or Below Median", sub=paste("Created Using R Statistical Package"))I really don't understand the ins and outs of the rbind or data.frame functions, and in another project, when I tried to repeat a similar analysis, it wouldn't work. I could not figure out what my error was, but I new enough about R to create the plots with an alternative implementation. It is not as compact, but more general, and it worked. (see code below, although it references a new data set with new vars and produces 4 density curves vs. 3)
# histogram and density estimates for all data
hs <- hist(trade_by_yr$logTrade,main="", xlab="trade", col="grey90", ylim=c(0, 95), breaks="fd", border=TRUE)  # histogram

dens <- density(trade_by_yr$logTrade)  # density
rs <- max(hs$counts)/max(dens$y)  # rescale/mormalize density
lines(dens$x, dens$y*rs, type="l", col=rainbow_hcl(4)[1]) # plot densiy

# density estimates for year 2000 trade data

y2000 <- trade_by_yr[trade_by_yr$year==2000,] # subset data for year
dens <- density(y2000$logTrade)  # density
rs <- max(hs$counts)/max(dens$y)  # rescale/mormalize density
lines(dens$x, dens$y*rs, type="l", col=rainbow_hcl(4)[2]) # plot densiy

# density estimates for year 2004 trade data

y2004 <- trade_by_yr[trade_by_yr$year==2004,]  # subset data for year
dens <- density(y2004$logTrade)  # density
rs <- max(hs$counts)/max(dens$y)  # rescale/mormalize density
lines(dens$x, dens$y*rs, type="l", col=rainbow_hcl(4)[3]) # plot densiy

# densty estimates for year 2008 trade data

y2008 <- trade_by_yr[trade_by_yr$year==2008,] # subset data for year
dens <- density(y2008$logTrade) # density
rs <- max(hs$counts)/max(dens$y)  # rescale/mormalize density
lines(dens$x, dens$y*rs, type="l", col=rainbow_hcl(4)[4]) # plot densiy

# Add a legend to the plot.

legend("topright", c("All", "2000", "2004", "2008"), bty="n", fill=rainbow_hcl(4))

# Add a title to the plot.

title(main="Distribution of Total World Trade Volume by Country by Year", sub=paste("Created Using R Statistical Package"))
See graph below:
To leave a comment for the author, please follow the link and comment on their blog: Econometric Sense.
R-bloggers.com offers daily e-mail updates about R news and tutorials about learning R and many other topics. Click here if you're looking to post or find an R/data-science job.
Want to share your content on R-bloggers? click here if you have a blog, or here if you don't.