Articles by benjaminlmoore

Ligature fonts for R

July 19, 2017 | benjaminlmoore

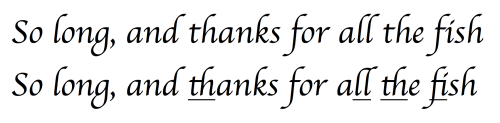
Ligature fonts are fonts which sometimes map multiple characters to a single glyph, either for readability or just because it looks neat. Importantly, this only affects the rendering of the text with said font, while the distinct characters remain in … Continue reading →
[Read more...]

The Mandelbrot Set in R

June 27, 2017 | benjaminlmoore

The Mandelbrot set is iconic and countless beautiful visualisations have been born from its deceptively simple recursive equation. R’s plotting ecosystem should be the perfect setting for generating these eye-catching visualisations, but to date the package support has been lacking. … Continue reading →
[Read more...]

Interactive charts in R

May 19, 2015 | benjaminlmoore

I’m giving a talk tomorrow at the Edinburgh R usergroup (EdinbR) on how to get started building interactive charts in R. I’ll talk about rCharts as a great general entry point to quickly generating interactive charts, and also the newer htmlwidgets … Continue reading →
[Read more...]

Recreating the vaccination heatmaps in R

April 9, 2015 | benjaminlmoore

In February the WSJ graphics team put together a series of interactive visualisations on the impact of vaccination that blew up on twitter and facebook, and were roundly lauded as great-looking and effective dataviz. Some of these had enough data available to look … Continue reading →
[Read more...]

Planning an R usergroup meeting in R

March 25, 2015 | benjaminlmoore

The Edinburgh R usergroup (EdinbR) put together a survey a while back to figure out some of the logistical details for organising a succesful meeting. We had 75 responses (and a few more after I grabbed the results) so here’s … Continue reading →
[Read more...]

EdinbR: A new R usergroup for Edinburgh

February 11, 2015 | benjaminlmoore

Inspired by succesful RUGs like LondonR and CambR, I’m pleased to announce a new R usergroup for those in and around Edinburgh: EdinbR! Edinburgh has a large research community using R, spread across different campuses and even universities so a … Continue reading →
[Read more...]

Celebrity twitter followers by gender

May 25, 2014 | benjaminlmoore

The most popular accounts on twitter have millions of followers, but what are their demographics like? Twitter doesn’t collect or release this kind of information, and even things like name and location are only voluntarily added to people’s profiles. Unlike Google+ … Continue reading → [Read more...]

What are the most overrated films?

May 5, 2014 | benjaminlmoore

“Overrated” and “underrated” are slippery terms to try to quantify. An interesting way of looking at this, I thought, would be to compare the reviews of film critics with those of Joe Public, reasoning that a film which is roundly-lauded by … Continue reading → [Read more...]

Author inflation in academic literature

April 6, 2014 | benjaminlmoore

There seems to be a general consensus that author lists in academic articles are growing. Wikipedia says so, and I’ve also come across a published letter and short Nature article which accept this is the case and discuss ways of … Continue reading → [Read more...]

Meticulously recreating bitmap plots in R

February 3, 2014 | benjaminlmoore

There’s a hard-fought drive on Wikimedia commons to convert those images that should be in vector format (i.e. graphs, diagrams) from their current bitmap form. At the time of writing, the relevant category has over 7000 images in the category … Continue reading → [Read more...]

Analyse your bank statements using R

January 4, 2014 | benjaminlmoore

Online banking has made reviewing statements and transferring money more convenient than ever before, but most still rely on external methods for looking at their personal finances. However, many banks will happily give you access to long-term transaction logs, and … Continue reading → [Read more...]

9 reasons to use RStudio

October 16, 2012 | benjaminlmoore

In no particular order, here are nine reasons why I really like the RStudio IDE for the R statistical programming language. 1) R benefits from an IDE – I accept that in some languages an IDE is unnecessary—Perl is the first example … Continue reading → [Read more...]

Never miss an update!
Subscribe to R-bloggers to receive
e-mails with the latest R posts.
(You will not see this message again.)

Click here to close (This popup will not appear again)