
Analyzing package dependencies and download logs from Rstudio, and a start towards building an R recommendation engine
Want to share your content on R-bloggers? click here if you have a blog, or here if you don't.
In this post, I will focus on the analysis of available R packages and the behavior of its users. In essence, this involves looking at the data in two different ways (1) relationships among available R packages in CRAN and (2) tracking the behavior of R users through download logs on CRAN mirrors. I will then leverage all this data to make a feeble attempt towards building an R recommendation engine…
PART I
Investigating dependency relationships among available R packages in CRAN
In this first section, I look at the dependency relationships among all available R packages in CRAN. To do so, I first wrote a Python script to scrape all the data from CRAN, and used a dictionnary data structure in which each key was a given target package, and its associated element was the list of packages it depended on. For example the entry for the package mixtools, which depends on the boot, MASS and segmented packages, is stored as:
package_dependency['mixtools'] = ["boot", "MASS", "segmented"]
Once this is done, it is straightforward to build an adjacency matrix and plot the network of R package dependencies (Couldn’t resist the temptation! I love me some network). For the visualization, I used the d3Network package made available by Christopher Gandrud. By clicking on the image below, you will be able to download a html file, which you can open in your browser to display an interactive force-directed network that shows dependencies among all R packages in CRAN. Each node has been color-coded according to the community it belongs to. For the sake of transparency, I should add that I removed all packages with no dependencies.
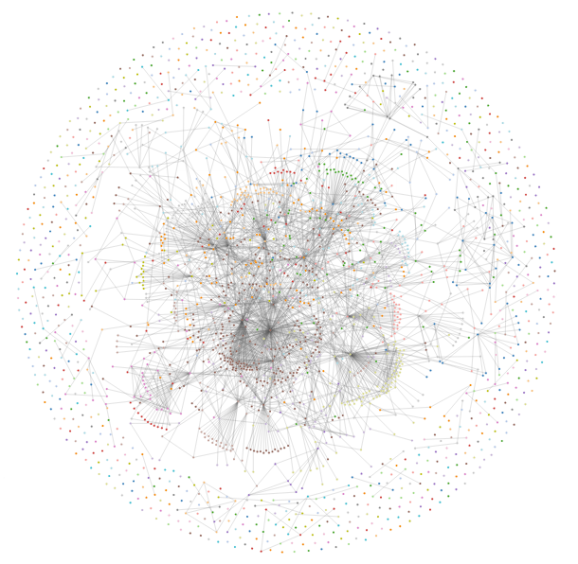
Graphical model summarizing the dependencies among all available R packages in CRAN
As an added bonus, I have also included the subset of the script used to generate this graph above.
# load required packages
require("igraph")
require('d3Network')

# assume mat is an adjacency matrix

# create edge list
g <- graph.adjacency(mat, mode = 'directed')
# remove loops
g <- simplify(g)
df <- get.edgelist(g, names=TRUE)
df <- as.data.frame(df)
colnames(df) <- c('source', 'target')
df$value <- rep(1, nrow(df))

# get communities
fc <- fastgreedy.community(g)
#ebc <- edge.betweenness.community(g, directed=TRUE)
com <- membership(fc)

node.info <- data.frame(name=names(com), group=as.vector(com))
links <- data.frame(source=match(df$source, node.info$name)-1,
                  target=match(df$target, node.info$name)-1,
                  value=df$value)

d3ForceNetwork(Links = links, Nodes = node.info,
               Source = "source", Target = "target",
               Value = "value", NodeID = "name",
               linkDistance = 250,
               Group = "group", width = 1300, height = 1300,
               opacity = 1, zoom = TRUE, file='network.html')
We can next look for the hub packages in our network, which is simply done by summing each rows of the adjacency matrix and sorting in descending order. The top terms will correspond to the packages on which many other packages depend on. Using this data, we can study the rate at which newly released packages depend on those hub packages, as shown in the figure below.

We can also look at the rate of updates that have occurred for each R package. You can notice a huge spike on October 2012. This could be attributable to the Rstudio 0.97.168 release of October 14th, 2012, which came with the addition of the RStudio CRAN mirror (via Amazon CloudFront) for fast package downloads.

Number of R packages updates each month between 2012 and 2014
PART II
Investigating properties of R package downloads in the Rstudio CRAN server
Back in June 2013, the Rstudio blog announced that it was providing anonymised log data gathered from its own CRAN mirror, an announcement that prompted a few people to analyze some of the available data: Felix Schonbrodt showed how to track R package downloads, Tal Galili looked for the most popular R packages, and James Cheshire also created a map showing the activity of R users across the world. First, we must download all the log data available on the Rstudio CRAN server, which we can do by using the example script provided here. Once we have collected all the data, we can begin to plot out some of the most obvious questions, for example, the number of downloads that occur every day:
Number of daily R package downloads on the Rstudio CRAN server 
We can also look at the number of unique users (which to my understanding can be inferred from the daily unique ids assigned to each IP adress) that download R packages from the Rstudio CRAN server:
Number of daily unique users to download R packages 
We can notice a couple of things from the two plots above:
- The weekly cycles in both user numbers and R package downloads, with strong activity during the weekdays and considerable dips during the weekend
- The obvious dips in activity during the Christmas-New year season, most notably during New Year’s eve, which unequivocally confirms the widespread belief that R users are indeed wild party animals that would rather celebrate than download R packages.
- There is an obvious peak in activity in both the number of unique users and package downloads that occurred on the 22nd June 2014. While I cannot confirm the causality of this, it is intriguing to note that Rstudio 0.98.932 was released the previous day. This version was particularly exciting because it introduced all new R markdown functionnalities and also allowed to produce interactive documents, which presumably could have driven a lot of people to update their version of Rstudio. (But again, those are only my meandering thoughts…)
Finally, we can check the operating system on which R users were depending at the time of their R package downloads:

We see that R users depend on various flavors of MAC OS or Linux, but that a wide majority of R users are Windows users. At this time, I feel like I should make some snide comment but that would be misguided, since it would (clearly!) mean insulting a lot of people. Also, if you are reading this and are one of the users still depending on MAC OS Tiger 10.4 – Stop. Let it go. It’s had its time. Upgrade.
PART III
Identifying pairs of packages that are often downloaded together
One thing that has alway surprised me about R is the complete absence of a package recommendation feature. While “recommendation features” can often be annoying and get in the way of things, I believe it should be possible to seamlessly embed this feature within the R experience, for example by replicating something along the lines of the package dependencies argument in the install.packages() function. R does have a “suggests” section in the package description, but I find it to be lacking a little.
There has been previous attempts to build an R package recommendation engine, most notably the competition hosted by KAGGLE a few years ago. Here, I just took the most straightforward approach, and simply looked at the number of co-occurring downloads among all pairs of R packages. Of course, I excluded all co-occurring downloads that could have been attributed to package dependencies. The top 20 co-occurring R package downloads are shown in the table below. The colummn headers are:
- package1: the first package in the pair of co-occuring R packages
- prob(package1): the frequency with which package 1 is downloaded at the same time as package 2. It is calculated as the ratio of (number of times package 1 is downloaded at the same time as package 2) / (number of total downloads for package 1)
- package2: the second package in the pair of co-occuring R packages
- prob(package2): the frequency with which package 2 is downloaded at the same time as package 1. It is calculated as the ratio of (number of times package 2 is downloaded at the same time as package 1) / (number of total downloads for package 2)
- the total number of times package 1 and package 2 were downloaded at the same time
| package 1 | prob(package1) | package 2 | prob(package2) | cooccurence count | |
|---|---|---|---|---|---|
| 1 | stringr | 0.7 | digest | 0.69 | 377437 |
| 2 | munsell | 0.85 | labeling | 0.86 | 318600 |
| 3 | scales | 0.77 | reshape2 | 0.69 | 315957 |
| 4 | scales | 0.77 | gtable | 0.86 | 312918 |
| 5 | munsell | 0.83 | dichromat | 0.86 | 311984 |
| 6 | munsell | 0.83 | ggplot2 | 0.44 | 311875 |
| 7 | labeling | 0.84 | dichromat | 0.85 | 310973 |
| 8 | ggplot2 | 0.44 | dichromat | 0.85 | 310945 |
| 9 | munsell | 0.82 | gtable | 0.85 | 309486 |
| 10 | labeling | 0.84 | ggplot2 | 0.44 | 308816 |
| 11 | gtable | 0.85 | dichromat | 0.85 | 307714 |
| 12 | labeling | 0.83 | gtable | 0.85 | 307147 |
| 13 | stringr | 0.56 | plyr | 0.51 | 304778 |
| 14 | proto | 0.8 | gtable | 0.84 | 303274 |
| 15 | scales | 0.74 | proto | 0.8 | 302578 |
| 16 | proto | 0.79 | dichromat | 0.83 | 301528 |
| 17 | proto | 0.79 | munsell | 0.8 | 300881 |
| 18 | reshape2 | 0.66 | gtable | 0.83 | 300809 |
| 19 | proto | 0.79 | labeling | 0.81 | 299554 |
| 20 | reshape2 | 0.65 | munsell | 0.79 | 298857 |
The table above shows that many co-occurring downloads of R packages involve color schemes. While package dependencies were removed from this analysis, we could actually further improve this by eliminating all pairs belonging to the same community of packages detected in Part I of this analysis.
Thanks for reading!

R-bloggers.com offers daily e-mail updates about R news and tutorials about learning R and many other topics. Click here if you're looking to post or find an R/data-science job.
Want to share your content on R-bloggers? click here if you have a blog, or here if you don't.