
Analyse your bank statements using R
Want to share your content on R-bloggers? click here if you have a blog, or here if you don't.
Online banking has made reviewing statements and transferring money more convenient than ever before, but most still rely on external methods for looking at their personal finances. However, many banks will happily give you access to long-term transaction logs, and these provide a great opportunity to take a DIY approach.
I’ll be walking through a bit of analysis I tried on my own account (repeated here with dummy data) to look for long-term trends on outgoing expenses. Incidentally, the reason I did this analysis was the combination of a long train journey and just 15 minutes free Wi-Fi (in C21 ?!), ergo a short time to get hold of some interesting data and a considerably longer time to stare at it.
Getting the data
First you need to grab the raw data from your online banking system. My account is with Natwest (UK), so it’s their format output I’ll be working with, but the principals should be easy enough to apply to the data from other banks.
Natwest offers a pretty straightforward Download Transactions dialogue sequence that’ll let you get a maximum of 12 months of transactions as a comma-separated value (CSV) flat file, it’s this we can download and analyse.

Download transaction history for the previous year as CSV.
Read this file you’ve downloaded into a data.frame:
s <- read.csv("<filename.csv>", sep=",", row.names=NULL)
colnames(s) <- c("date", "type", "desc", "value",
                 "balance", "acc")
s$date <- as.Date(s$date, format="%d/%m/%Y")

# Only keep the useful fields
s <- s[,1:5]
This will give you a 5-column table containing these fields:
- Date
- Type
- Description
- Value
- Balance
It should go without saying that the CSV contains sensitive personal data, and should be treated as such — your account number and sort code are present on each line of the file!
Parsing the statement
The most important stage of processing your transaction log is to classify each one into some meaningful group. A single line in your transaction file may look like this:
07/01/2013,POS,"'0000 06JAN13 , SAINSBURYS S/MKTS , J GROATS GB",-15.90,600.00,"'BOND J","'XXXXXX-XXXXXXXX",
Given the headers above, we can see that most of the useful information is contained within the quoted Description field, which is also full of junk. To get at the good stuff we need the power of regular expressions (regexp), but thankfully some pretty simple ones.
In fact, given the diversity of labels in the description field, our regular expressions end up essentially as lists of related terms. For example, maybe we want to group cash machine withdrawals; by inspecting the description fields we can pick out some useful words, in this case bank names like NATWEST, BARCLAYS and CO-OPERATIVE BANK. Our “cash withdrawal” regexp could then be:
"NATWEST|BARCLAYS|BANK"
And we can test this on our data to make sure only relevant rows are captured:
s[grepl("NATWEST|BARCLAYS|BANK", s$desc),]
Now you can rinse and repeat this strategy for any and all meaningful classes you can think of.
# Build simple regexp strings
coffee <- "PRET|STARBUCKS|NERO|COSTA"
cash <- "NATWEST|BARCLAYS|BANK"
food <- "TESCO|SAINSBURY|WAITROSE"
flights <- "EASYJET|RYANAIR|AIRWAYS"
trains <- "EC MAINLINE|TRAINLINE|GREATER ANGLIA"
# Do this for as many useful classes as you can think of

# Add a class field to the data, default "other"
s$class <- "Other"

# Apply the regexp and return their class
s$class   ifelse(grepl(food, s$desc), "Food",
    ifelse(grepl(flights, s$desc), "Flights",
      ifelse(grepl(trains, s$desc), "Trains", "Other")))))
Aggregating and plotting the data
Now we’ve got through some pre-processing we can build useful plots in R using the ggplot2 package. It’ll also be useful to aggregate transactions per month, and to do this we can employ another powerful R package from Hadley Wickham, plyr.
# Add a month field for aggregation
s$month <- as.Date(cut(s$date, breaks="month"))

# NB. remove incoming funds to look at expenses!
s <- subset(s, s$value < 0)

# Build summary table of monthly spend per class
library(plyr)
smr <- ddply(s, .(month, class), summarise,
             cost=abs(sum(value)))
Now we can plot these monthly values and look for trends over the year by fitting a statistical model to the observed data. In this example, I’ll use the loess non-linear, local regression technique which is one of the available methods in the geom_smooth layer.
library(ggplot2)
ggplot(smr, aes(month, cost, col=class)) +
  facet_wrap(~class, ncol=2, scale="free_y") +
  geom_smooth(method="loess", se=F) + geom_point() +
  theme(axis.text.x=element_text(angle=45, hjust=1),
        legend.position="none") +
  labs(x="", y="Monthly total (£)")

Monthly totals for each class of expense are shown over 12 months for example data.
In this example, it seems the person has possibly stopped paying for things in cash as much, and has swapped trains for flying! However a significant amount of the transaction log remain classified as “other” — these transactions could be split into several more useful classes with more judicious use of regexp. This becomes pretty obvious when you look at the mean monthly spend per class:
yl <- ddply(smr, .(class), summarise, m=mean(cost))

ggplot(yl, aes(x=class, y=m)) +
  geom_bar(stat="identity") +
  labs(y="Average monthly expense (£)", x="")
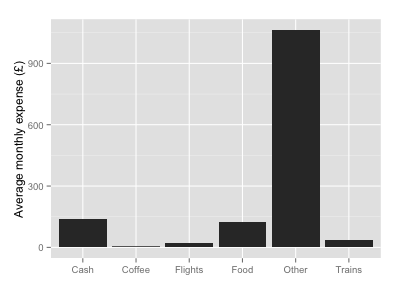
Overwhelmingly “other” — needs more work!
Hopefully this gives you some ideas of how to investigate your own personal finance over the past year!
Here’s the full code to run the above analysis, which should work as-is on any CSV format transaction history downloaded for a single Natwest account.

R-bloggers.com offers daily e-mail updates about R news and tutorials about learning R and many other topics. Click here if you're looking to post or find an R/data-science job.
Want to share your content on R-bloggers? click here if you have a blog, or here if you don't.