

[This article was first published on modTools, and kindly contributed to R-bloggers]. (You can report issue about the content on this page here)
Want to share your content on R-bloggers? click here if you have a blog, or here if you don't.
Want to share your content on R-bloggers? click here if you have a blog, or here if you don't.
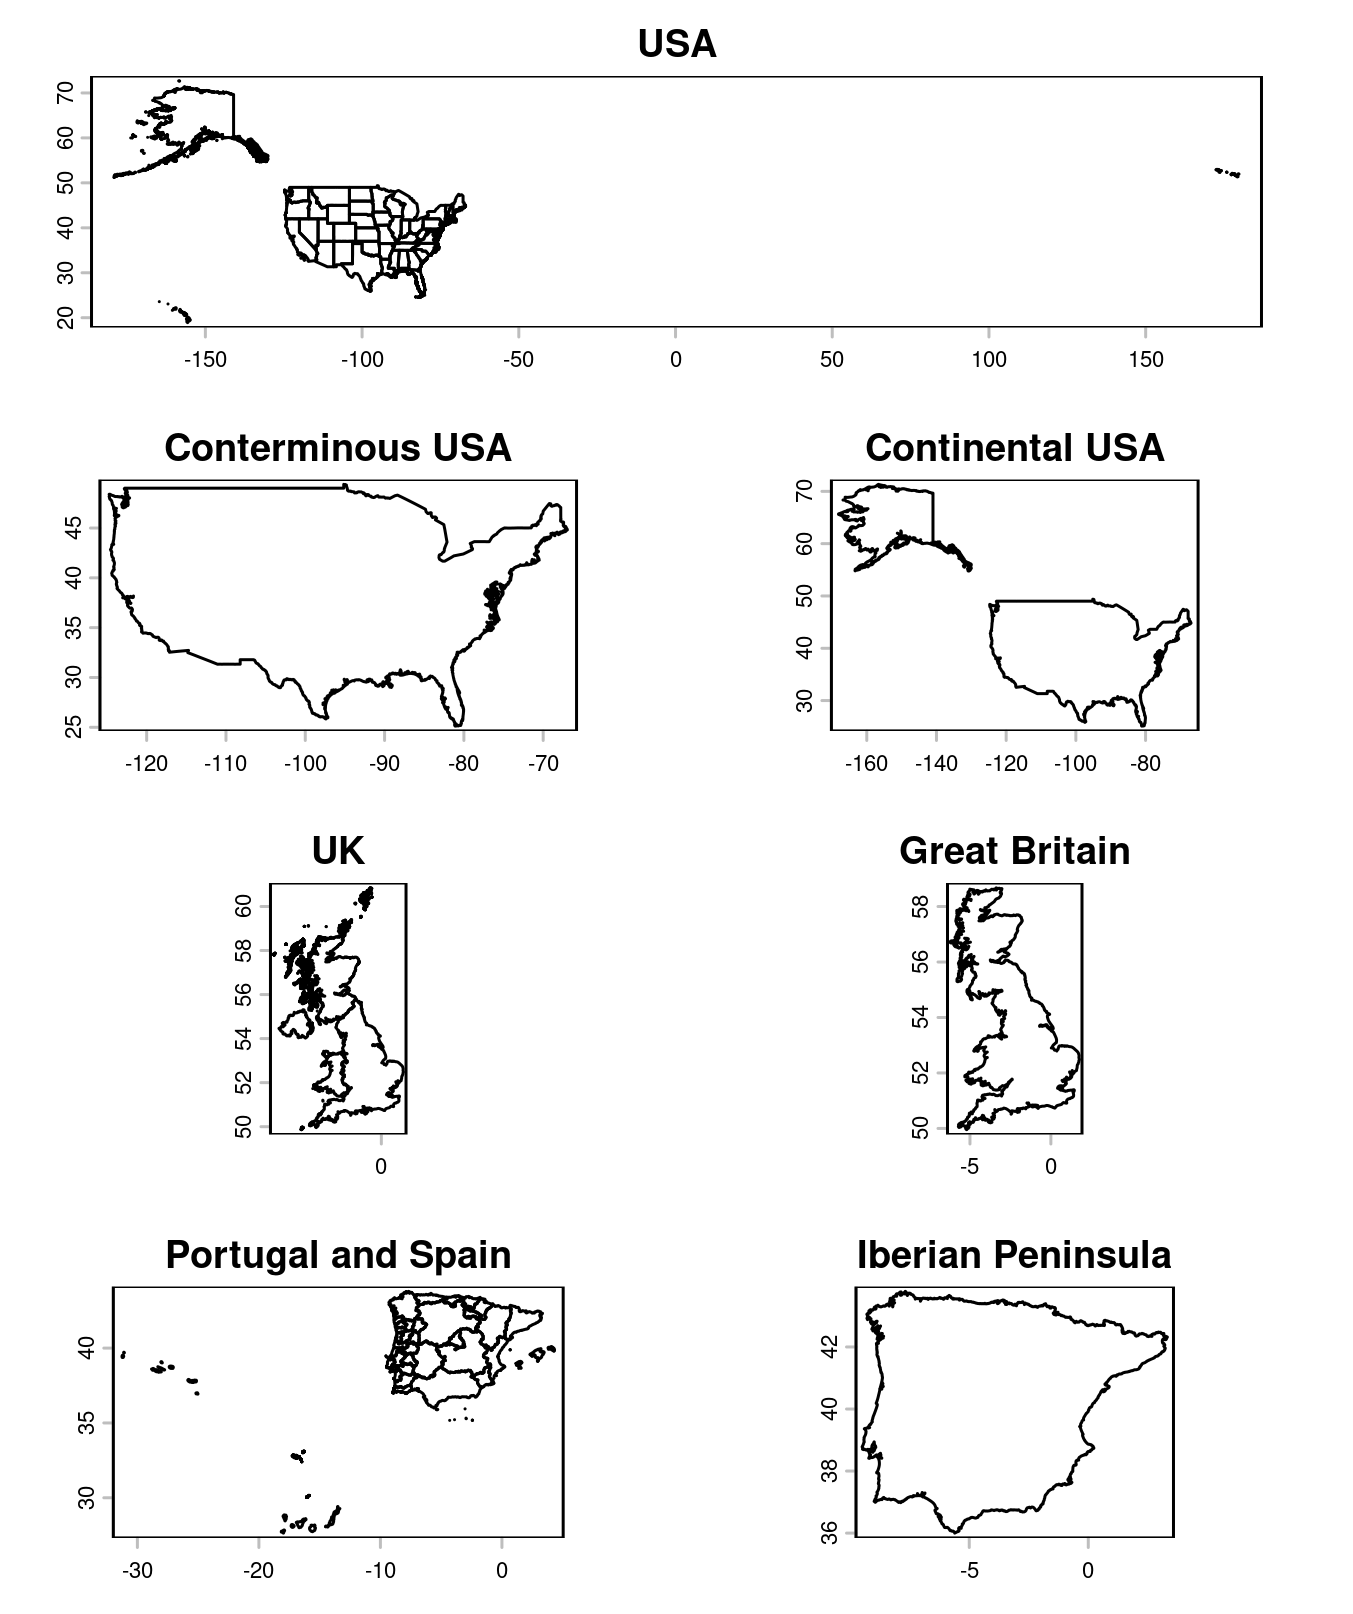
I often need to get mainland from country / administrative region polygons, so I finally decided to write a function to help automate it. It selects the N largest feature(s) in a polygons or lines map. Here’s the code:
selectLargest <- function(x, # terra SpatVector polygons or lines n = 1, # number of largest features to retain dissolve = FALSE, # whether to group contiguous features singleparts = TRUE # whether to disaggregate multi-part features) { stopifnot(inherits(x, "SpatVector"), terra::geomtype(x) %in% c("polygons", "lines")) if (dissolve) { x <- terra::aggregate(x) } if (singleparts) { x <- terra::disagg(x) } if (terra::is.polygons(x)) { size_rank <- order(terra::expanse(x), decreasing = TRUE) } else if (terra::is.lines(x)) { size_rank <- order(terra::perim(x), decreasing = TRUE) } x[size_rank[1:n], ]}
The dissolving of internal borders is optional. Here are some usage examples:
library(terra)library(geodata)# import a USA map and get the conterminous and continental parts:usa <- geodata::gadm("United States", level = 1, path = tempdir())mainland_usa <- selectLargest(usa, dissolve = TRUE)contin_usa <- selectLargest(usa, dissolve = TRUE, n = 2) # two largest polygons, to include Alaskaplot(usa, main = "USA")plot(mainland_usa, main = "Conterminous USA")plot(contin_usa, main = "Continental USA")# import a UK map and get Great Britain:uk <- geodata::gadm("United Kingdom", path = tempdir())great_britain <- selectLargest(uk, dissolve = TRUE)plot(uk, main = "UK")plot(great_britain, main = "Great Britain")# import a Portugal + Spain map and get the Iberian Peninsula:ptes <- geodata::gadm(c("Portugal", "Spain"), path = tempdir())iberia <- selectLargest(ptes, dissolve = TRUE)plot(ptes, main = "Portugal and Spain")plot(iberia, main = "Iberian Peninsula")
As usual, feedback is welcome!
To leave a comment for the author, please follow the link and comment on their blog: modTools.
R-bloggers.com offers daily e-mail updates about R news and tutorials about learning R and many other topics. Click here if you're looking to post or find an R/data-science job.
Want to share your content on R-bloggers? click here if you have a blog, or here if you don't.