

Want to share your content on R-bloggers? click here if you have a blog, or here if you don't.
I recently learned about an interesting way of reducing the dimension of a data set. I’d like to illustrate it with a data set of about 550 historical battles in the UK, extracted from Wikidata using a SPARQL query. No doubt some readers will have seen this idea before, but it’s new to me and I found it pretty.
The following plot shows the raw data, with a crossed swords symbol for the location of each battle. It’s possible to see some patterns on the plot (for example, it probably wasn’t much fun to live on the borders of mediaeval Wales) but it could be clearer.


One way to visualise battles over time is to make a 2D graph with time on one axis and location on another axis. But how do you plot a 2D location on a 1D line? One answer is to use a space-filling curve, which in this case will be a curve which snakes all over the map, visiting every location once. This won’t necessarily preserve the relationship between points (points which are close together in 2D could be far apart in 1D) but at least points which are close together in 1D are guaranteed to be close together in 2D.
One example of a space-filling curve is the Hilbert curve. A typical Hilbert curve can be created by writing a function which takes an integer n as input and produces a $2^n \times 2^n$ matrix like this:
This matrix should be interpreted as a curve which starts at zero and follows the numbers in order, like this:


As n increases, the curve becomes more and more complicated. The visualisation below uses a $64 \times 64$ grid and a curve like this:

For the final visualisation, I used a rectangle between $-6$ and $1.8$ degrees longitude and $49.8$ and $58$ latitude. I added the locations of some cities to the plot and plotted squares which were mostly sea as blue lines.

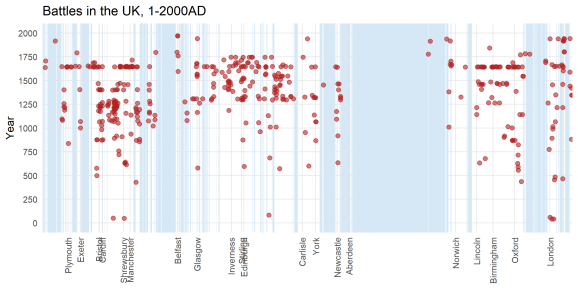
I quite like the visualisation. Firstly, you can see some of the geography. There are three clusters of points which, going from left to right, seem to correspond roughly to Wales, Scotland, and England (the original data contained part of Ireland, but I cut out most of it using the bounding rectangle). Periods of extended conflict over a particular place appear as vertical columns of points. When there was a general conflict over a wide area, you see a horizontal line of points. Some features of the data are much more obvious on this visualisation than on the original map.

I’ve highlighted a few interesting features. The most obvious is the line of points highlighted in yellow, which correspond to the English Civil War. The points highlighted in purple are the Jacobite Rebellion, which up to now were the last major land battles in the UK. The long Conquest of Wales which was also visible on the original map is highlighted in turquoise.
Various other patterns can be detected by staring at the map. The weird-looking row of points near London highlighted in green are various battles from the twentieth century, mostly associated with the two world wars, including the Battle of Britain and various naval engagements.
Overall, I thought this was a very interesting technique, and I wonder where it comes from. Who came up with the idea of using a space-filling curve for dimension reduction? Is there an optimal way to do it (i.e. given some data, is there a “best” way of choosing a space-filling curve to minimise distortion in your plot?) I don’t know!
R-bloggers.com offers daily e-mail updates about R news and tutorials about learning R and many other topics. Click here if you're looking to post or find an R/data-science job.
Want to share your content on R-bloggers? click here if you have a blog, or here if you don't.