

Want to share your content on R-bloggers? click here if you have a blog, or here if you don't.
Following this previous post and this discussion on Mastodon, I wrote a function that wraps a combination of functions from the ‘terra’ package to project a SpatRaster or SpatVector layer while automatically centering the projection on that layer, to minimize visual distortion:
projectCentered <- function(x, # SpatRaster or SpatVector proj = "laea" # +proj parameter for PROJ.4 string ) { # version 1.0, by A. Marcia Barbosa stopifnot(inherits(x, "SpatRaster") || inherits(x, "SpatVector")) if (terra::crs(x) == "" || is.na(terra::crs(x))) { stop("'x' does not have a CRS to project") } if (inherits(x, "SpatRaster")) { a <- terra::as.polygons(x * 0) } if (inherits(x, "SpatVector") && length(x) > 1) { a <- terra::aggregate(x) } else { a <- x } if (!isTRUE(terra::is.lonlat(a))) { a <- terra::project(a, "EPSG:4326") } centr <- terra::crds(terra::centroids(a)) proj <- tolower(proj) proj <- sub("+proj=", "", proj, fixed = TRUE) # in case user input prefix CRS <- paste( paste0("+proj=", proj), paste0("+lat_0=", centr[2]), paste0("+lon_0=", centr[1]) ) tryCatch(terra::project(x, CRS), error = function(e) stop("'proj' is invalid"))}
Here is a use case (compared with the default behaviour), using e.g. Lambert Azimuthal Equal-Area projection:
library(terra)library(geodata)countries <- geodata::world(path = tempdir())map <- subset(countries, countries$NAME_0 %in% c("New Zealand", "Australia"))par(mfrow = c(1, 3))plot(map, main = "Unprojected")plot(project(map, "+proj=laea"), main = "Projected, default-centered")plot(projectCentered(map, "laea"), main = "Projected, map-centered")
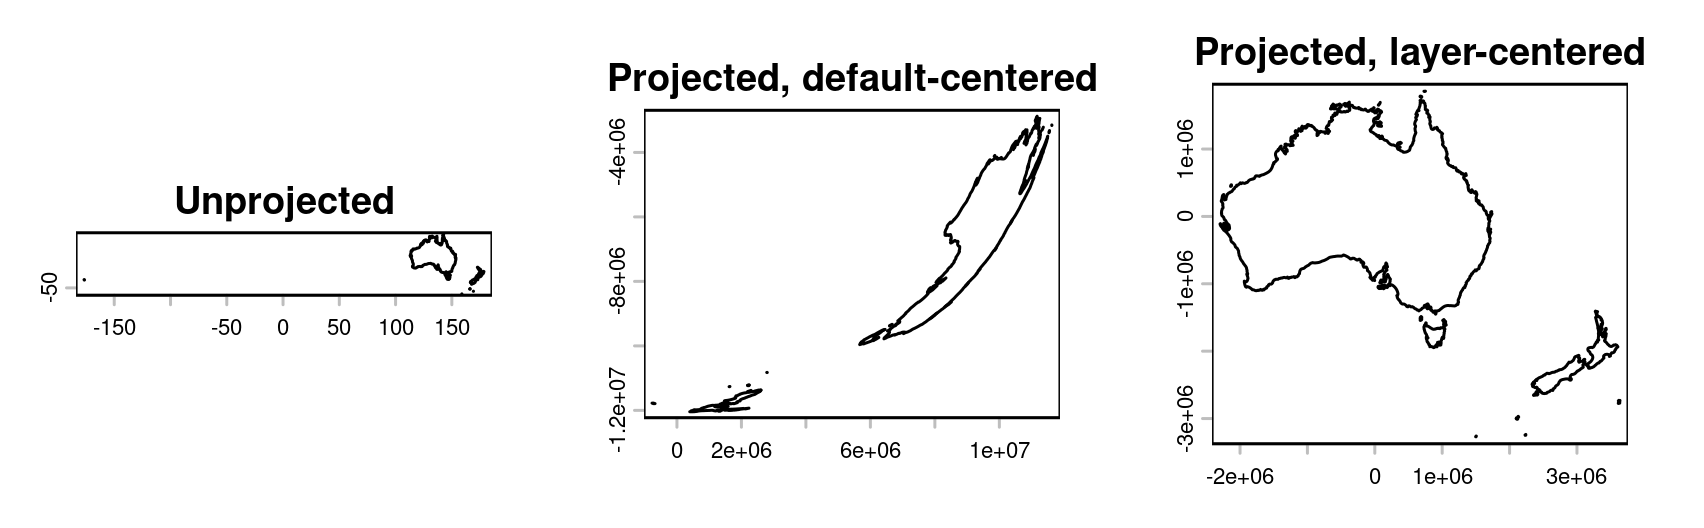
This is meant to be used for visualization purposes. For computing e.g. areas or distances, it is better to use unprojected layers, with longitude-latitude coordinates in degrees (making sure that spherical geometry or geodesic algorithms are being used), so that the Earth’s curvature is taken into account.
Note that I just plotted the bare minimum to illustrate what the ‘projectCentered’ function does. Maps can be made to look much nicer — even with just terra + base R plots, with no added package dependencies!
R-bloggers.com offers daily e-mail updates about R news and tutorials about learning R and many other topics. Click here if you're looking to post or find an R/data-science job.
Want to share your content on R-bloggers? click here if you have a blog, or here if you don't.