

Want to share your content on R-bloggers? click here if you have a blog, or here if you don't.
Graphical user interfaces for the R language are easy to use and getting more powerful all the time. Here is my updated comparison of jamovi, JASP, BlueSky Statistics (free & Pro), Rattle, RKWard, R-Instat, R AnalyticFlow, and R Commander.
With so many detailed reviews of Graphical User Interfaces (GUIs) for R available, which should you choose? It’s not too difficult to rate them based on the number of features they offer, so I’ll start there. Then, I’ll follow with a brief overview of each.
I’m basing the counts on the number of dialog boxes in each category of the following categories:
- Ease of Use
- General Usability
- Graphics
- Analytics
- Reproducibility
This data is trickier to collect than you might think. Some software has fewer menu choices, depending instead on more detailed dialog boxes. Studying every menu and dialog box is very time-consuming, but that is what I’ve tried to do to keep this comparison trustworthy.
Perhaps the biggest flaw in this methodology is that every feature adds only one point to each GUI’s total score. I encourage you to download the full dataset and consider which features are most important to you. If you decide to make your own graphs with a different weighting system, I’d love to hear from you in the comments below. Thomas Langkamp did an excellent comparison focused on teaching statistics. You can read it here.
Ease of Use
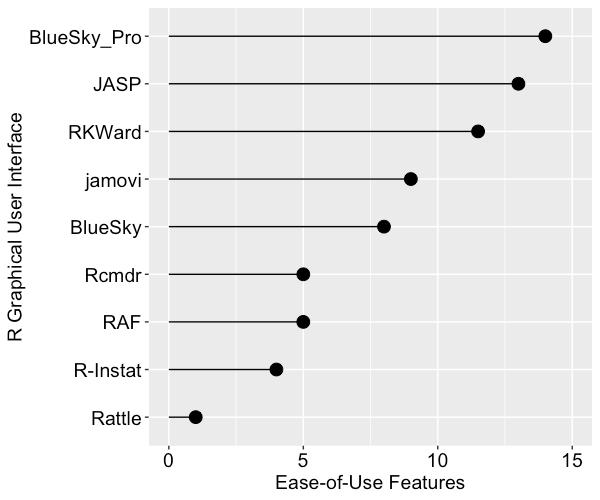
For ease of use, I’ve defined it primarily by how well each GUI meets its primary goal: avoiding code. They get one point for each of the following abilities, which include being able to install, start, and use the GUI to its maximum effect, including publication-quality output, without knowing anything about the R language itself. Figure 1 shows the result. R Commander is abbreviated Rcmdr, and R AnalyticFlow is abbreviated RAF. The commercial BlueSky Pro comes out on top by a slim margin, followed closely by JASP and RKWard. None of the GUIs achieved the highest possible score of 15, so there is room for improvement.
The ease of use features are:
- Installs without the use of R
- Starts without the use of R
- Remembers recent files
- Hides R code by default
- Uses its full capability without needing R code
- Data editor included
- Pub-quality tables w/out R code steps
- Simple menus that grow as needed
- Table of Contents to ease navigation
- Variable labels ease identification in the output
- Easy to move blocks of output
- Ease reading columns by freezing headers of long tables
- Accepts data pasted from the clipboard
- Easy to move header row of pasted data into the variable name field
- Includes AI interface to ease interpretation of output
General Usability
This category is dominated by data-wrangling capabilities, which data scientists and statisticians spend most of their time on. It also includes various types of data input and output. We see in Figure 2 that both BlueSky versions and R-Instat come out on top, not just due to their excellent selection of data-wrangling features but also for their use of the rio package for importing and exporting files. The rio package combines the import/export capabilities of many other packages, and it is easy to use. I expect the other GUIs will eventually adopt it, raising their scores by around 20 points.
The general usability features are:
- Operating systems (how many)
- Import data file types (how many)
- Import from databases (how many)
- Export data file types (how many)
- Languages displayable in UI (how many, besides English)
- Easy to repeat any step by groups (split-file)
- Multiple data files open at once
- Multiple output windows
- Multiple code windows
- Variable metadata view
- Variable types (how many)
- Variable search/filter in dialogs
- Variable sort by name
- Variable sort by type
- Variable move manually
- Model Builder (how many effect types)
- Magnify GUI for teaching
- R code editor
- Comment/uncomment blocks of code
- Package management (comes with R and all packages)
- Output: word processing features
- Output: R Markdown
- Output: LaTeX
- Data wrangling (how many)
- Transform across many variables at once (e.g., row mean)
- Transform down many variables at once (e.g., log, sqrt)
- Assign factor labels across many variables at once
- Project saves/loads data, dialogs, and notes in one file

Graphics
This category consists mainly of the number of plot types each software offers. However, the other items can be very important to completing your work. They should add more than one point to the graphics score, but I scored them one point since some will view them as very important while others might not need them at all. Be sure to see the full reviews or download the Excel file if those features are important to you. Figure 3 shows the total graphics score for each GUI. jamovi has a solid lead in this category. R-Instat’s ability to layer any geometric object, or “geom,” on top of another could substantially increase its count, but I don’t include that since it requires knowledge of R code.
When studying all the graphs in this article, it’s important to consider the difference between the relative and absolute performance. For example, relatively speaking, R Commander is not doing well here, but it does offer over 25 types of plots! That might be fine for your needs.
The graphics features are:
- Types of graphs (how many)
- Small multiples (i.e., facets)
- Large multiples (i.e., by group / split-file)
- Export graphics formats (how many)
- Interactive Plot Builder
- Interactive Plot Editor (e.g., add annotations, arrows, etc.)
- Able to combine any graphs into a single image
R-bloggers.com offers daily e-mail updates about R news and tutorials about learning R and many other topics. Click here if you're looking to post or find an R/data-science job.
Want to share your content on R-bloggers? click here if you have a blog, or here if you don't.