

Want to share your content on R-bloggers? click here if you have a blog, or here if you don't.
Three hundred twenty-three of the new packages were submitted to CRAN in May. Here are my Top 40 picks in eighteen categories: Artificial Intelligence, Computational Methods, Ecology, Education, Finance, Functional Data Analysis, Genomics, Machine Learning, Medical Statistics, Meta Analysis, Probability, Process Control, Psychometrics, Statistics, Surveys, Time Series, Utilities, and Visualization.
Artifical Intelligence
corteza v0.6.9: Implements an agent runtime that gives Large Language Models (LLMs) from Anthropic, OpenAI, Moonshot, and Ollama direct access to a live R session with managed workspace state. Tools execute as function calls with provenance tracking, and a deterministic retrieval system keeps relevant objects in context across turns. There are three entry points: a shell command-line interface, a console read-eval-print-loop, and a Model Context Protocol server for external clients. There are four vignettes, including Package as Skill and Skills.
ElicitationWizard v0.1.0: Implements a Shiny application for eliciting Bayesian prior distributions using large language models (LLMs). Supports multiple LLM experts, linear opinion pooling, and the Delphi method for iterative consensus. For more details, see Falconer et al. (2022) and Selby et al. (2025). There is a Getting Started vignette and a Tutorial.
Computational Methods
boids4R v0.3.1: Provides deterministic two- and three-dimensional boids and swarm simulations implementing Reynolds-style separation, alignment, and cohesion rules with optional obstacles, attractors, predators, species parameters, and reproducible frame export. The simulation state is renderer-neutral, meaning that optional adapters can transfer data to visualization packages such as ggWebGL. The model follows Reynolds (1987). There are five vignettes, including Getting Started and Scenario Gallery.

combss v0.1.0: Reformulates the NP-hard discrete subset selection problem as a continuous optimisation over the hypercube

diffcp v0.1.1: Provides a port of the python diffcp package. Functions compute the derivative of the optimal solution map of a convex cone program, treating the program as an implicit function of its data (constraint matrix, offset, objective coefficients, and optionally a quadratic), mirroring Agrawal et al. (2019). See the vignette.
LangevinFlow v0.1.0: Implements Langevin diffusion based Markov chain Monte Carlo samplers, including the Unadjusted Langevin algorithm and the Metropolis-Adjusted Langevin algorithm with minimal dependencies, with the intention of supporting Bayesian inference and stochastic optimization. The core sampling loops are written in C++ via Rcpp and RcppArmadillo Methods follow Roberts and Tweedie (1996) and Roberts and Rosenthal (1998). See the vignette.
Ecology
BRCore v2.0.7: Implements a unified framework for the identification and ecological interpretation of core microbiomes across time and space, enhancing robustness and reproducibility in microbiome data analysis. See Shade A, Stopnisek N (2019). See Sloan et al. (2006) for details on abundance-occupancy distributions and Burns et al. (2015) for neutral models. The vignette provides an introduction.

ELAplus v1.0.2: Provides tools for Energy landscape analysis and a systematic method for analyzing an energy landscape represented as a weighted network. Functions are especially designed to analyze ecological dynamics, i.e., transitions in community compositions. See Suzuki et al. (2021) for details about the analysis framework and the vignette for examples.

fb4package v2.1.0: Implements the Fish Bioenergetics 4.0 framework described in Deslauriers et al. (2017) and provides automated parameter optimization, multi-prey diet modeling, and comprehensive energy budget simulations for fisheries research and aquaculture applications. Includes species-specific parameter databases and tools for modeling fish growth, consumption, and metabolism under varying environmental conditions. There are six vignettes, including Introduction and Temperature Sensitivity and Climate Change Scenarios.

Education
bibnets v0.6.0: Provides functions to import, construct, and export bibliometric networks from scholarly metadata. Reads Scopus, Web of Science, BibTeX, RIS, OpenAlex, Lens.org, Dimensions, and Crossref exports. Goes beyond standard co-networks with attention-weighted networks, position-aware counting, similarity and dissimilarity normalisations, temporal networks, and local citation scoring. See López-Pernas, Saqr & Apiola (2023) for the methods involved. There are four vignettes, including Getting Started and Reading bibliometric data.
< section id="finance" class="level3">Finance
contagionchannels v0.1.3: Implements a two-stage framework for the joint detection and attribution of cross-border financial contagion. Stage one detects directional information flows between equity markets. Stage two attributes each significant directional link to one of five mutually exclusive transmission channels: trade, financial, Ggopolitical, behavioural, or monetary policy. The package also bundles datasets and scripts to reproduce the headline findings of Bhandari, Parida and Sahu (2026). There are three vignettes, including Using Custom Datasets and Methodology Guide.
< section id="functional-data-analysis" class="level3">Functional Data Analysis
SmoothPLS v0.1.5: Implements the partial least-squares algorithm for functional data through the concept of active area integration by building upon the basis expansion methods described in Aguilera et al. (2010). Functions handle both scalar and categorical functional data and interpretable regression curves, even for discrete state changes. There are six vignettes, including smoothPLS ScalarFD and SmoothPLS multi state.

Genomics
cclustr v0.1.1: Provides tools for performing consensus clustering on multiple imputed datasets that support a range of clustering algorithms across imputations, including hierarchical methods, partition-based approaches such as k-means, and methods for mixed or categorical data. Consensus solutions are derived via hierarchical clustering applied to a dissimilarity matrix. The consensus clustering framework is based on Monti et al. (2003), rank aggregation methods follow Pihur et al. (2007), and the proportion of ambiguous clustering metric is based on Senbabaoglu et al. (2014). See the vignette.

Machine Learning
tmfast 0.1.1: Provides functions to fit topic models using varimax-rotated principal component analysis, following the “vintage factor analysis” approach of Rohe & Zheng (2020). Leverages truncated PCA via irlba for sparse matrices, enabling fast model fitting on large corpora. Includes an information-theoretic approach to vocabulary selection, broom-compatible tidiers for extracting word-topic and topic-document matrices into a tidy data workflow, and samplers for constructing simulated corpora for benchmarking and method evaluation. There are two vignettes Fast topic modeling with real books and Fitting topic models with tmfast.

Medicine
BSET v1.0: Implements the Bayesian Surrogate Evaluation Test (BSET) for assessing the validity of surrogate markers in clinical trials and provides hypothesis testing tools to evaluate whether a surrogate can reliably estimate the causal effect of a treatment on a primary outcome. Addresses key limitations of the frequentist method, including the lack of causal interpretability and the inability to adjust for covariates in the estimation process. See Carlotti and Parast (2026), Parast et al. (2024) for background and the vignette for a tutorial.

DICErClust v0.1.2: Implements Deep Significance Clustering (DICE), a self-supervised learning framework designed to identify clinically meaningful and risk-stratified patient subgroups from electronic health record data. DICE jointly optimizes deep representation learning, clustering, and outcome prediction while enforcing statistical significance between predicted outcomes and cluster membership, and produces subgroups that are both clinically coherent and predictive. See Huang et al. (2021) and the vignettes Introduction and Heart Failure Risk Stratification.
< section id="meta-analysis" class="level3">Meta Analysis
MetaHunt v0.1.0: Provides tools for privacy-preserving meta-analysis of function-valued quantities across heterogeneous studies. Implements a pipeline that includes the denoised functional successive projection algorithm for basis hunting, constrained weight estimation, Dirichlet regression of weights on study-level covariates, target prediction, and split/cross conformal prediction intervals. The methodology described in Shi, Imai, and Zhang (2026). There are eight vignettes, including Get started and An Introduction.

Probability
BetaDanish v0.2.0: Implements the four-parameter Beta-Danish distribution and its three-parameter submodel for survival and reliability analysis, based on Ahmad and Danish (2025), and provides functions for density, distribution, quantile, hazard, and random generation. There are five vignettes, including Introduction and Bayesian Estimation.
mhn v0.1.0: Provides density, distribution, quantile, and random generation functions for the Modified Half-Normal (MHN) distribution, along with moments, mode, and the Fox-Wright Psi function used as the normalizing constant. The MHN distribution arises as a conditional posterior in Bayesian MCMC and generalizes the half-normal, truncated normal, and square-root gamma distributions. Implements efficient sampling via the Sun, Kong & Pal (2023) algorithms and the Gao & Wang (2025) RTDR method. See the vignettes Introduction and Theoretical Background.

Process Control
shewhartr v1.3.0: Provides a toolkit for statistical process control that combines the rigor of classical Shewhart methodology with modern tidyverse-native interfaces that include classical control charts, regression-based control charts for processes with trend, Nelson runs tests, average run length simulation, process capability indices, and Box-Cox transformation guidance. See Montgomery (2019), Nelson (1984), and Woodall (2000) for background. There are eleven vignettes, including Getting started and Regression-based control charts.

Psychometrics
personnelSelectionUtility v1.0.2: Implements classical and contemporary utility-analysis methods for personnel selection, organised by criterion scale and selection structure. Provides multiple methods, including Taylor-Russell classification Taylor and Russell (1939), and Brogden-Cronbach-Gleser monetary utility Brogden (1949). There are five vignettes, including Reproducing canonical examples from the literature and Utility-analysis taxonomy for personnel selection.
Statistics
bvarnet v1.0.1: Provides functions for the Bayesian estimation of multilevel vector autoregression models using Stan. Supports Gaussian, binary, and ordinal (adjacent category) outcome variables with random effects and customizable priors. There are six vignettes, including an introduction and Mixed Model.

glmbayes v0.9.5: Provides Bayesian linear and generalized linear model fitting with independent and identically distributed posterior samples. Features include functions that mirror lm() and glm() interfaces, prior family specifications for Gaussian, Poisson, Binomial, and Gamma models with log-concave likelihoods, accept-reject sampling for non-conjugate priors, and optional OpenCL acceleration for larger models. See Nygren and Nygren (2006) for accept-reject methods. There are twenty-seven vignettes, including Getting started and Foundations of GLMs.
griddy v0.1.0: Provides tools for exploratory geospatial distribution dynamics with sf objects. Includes pooled and time-specific classification of longitudinal spatial values, classic discrete Markov transition matrices, spatial Markov matrices conditioned on spatial-lag classes, endpoint and adjacent rank mobility summaries, and ggplot2 visualizations. Methods follow Rey (2001) and Rey et al. (2016). See the vignette to get started.

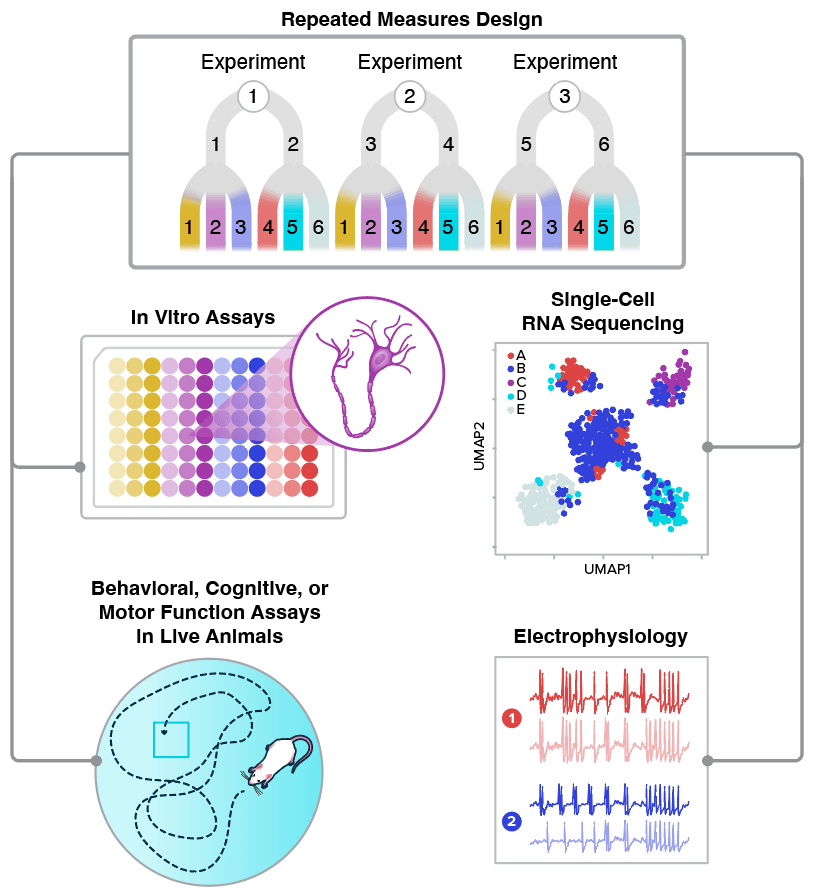
RMeDPower2 v1.0.2: Provides functions to analyze data from repeated measures experiments with hierarchical or crossed experimental designs. Supports testing modeling assumptions, identifying outlier observations and experimental units, estimating statistical power, and performing sample size calculations. For details, see Shin et al. (2022) and Bates et al. (2015). See the vignette for a tutorial.
ROCsurvcomp v0.1.2: Implements nonparametric and semiparametric methods for comparing two survival distributions under non-proportional hazards. The methods are based on the Receiver Operating Characteristic (ROC) curve length described in Bantis et al. (2021) and the overlap coefficient method of Franco-Pereira et al. (2021), as well as a joint ROC length-OVL-based approach. See the vignette.

sssvcqr v0.0.4: Implements sparse-smooth spatially varying coefficient quantile regression combining the quantile regression of Koenker and Bassett (1978) with grouped variable selection of Yuan and Lin (2006), graph regularization, and the alternating direction method of multipliers of Boyd et al. (2011). Functions provide graph-regularized estimation, spatially blocked cross-validation, prediction, diagnostics, and simulation helpers for global-local spatial quantile regression. See the vignettes Getting Started and Lucas County Housing Example.

TemporalHazard v1.1.0: Implements the multiphase parametric hazard model of Blackstone, Naftel, and Turner (1986) with a focus on behavioral parity, transparent numerics, and provides reproducible validation against reference outputs from the original C/SAS HAZARD program, originally developed at the University of Alabama at Birmingham. The generalized temporal decomposition family extends to longitudinal mixed-effects settings Rajeswaran et al. (2018). There are eight vignettes, including Mathematical Foundations and Prediction & Visualization.

Surveys
stepssurvey v0.1.0: Provides a complete analysis pipeline for the WHO STEPwise Approach to NCD Risk Factor Surveillance (STEPS) as described in Riley et al. (2016). Imports raw survey data (CSV, Excel, Stata, SPSS), applies WHO-standard cleaning and re-coding, sets up complex survey designs, computes all standard NCD indicators, and generates publication-ready tables, visualizations, and reports. There are four vignettes, including Preparing STEPS Data for Analysis and Interactive Analysis with the Shiny App.

surveycore v1.0.0: Implements a modern, S7-based foundation for survey analysis spanning both probability and non-probability samples. Probability sample designs include Taylor series linearization, replicate weights (BRR, Fay, jackknife, bootstrap), and two-phase estimation, following Lumley (2004). Non-probability sample designs support bootstrap and jackknife variance estimation for opt-in panels and convenience samples. There are three vignettes, including Getting Started and surveycore vs. survey and srvyr.
surveyframe v0.3.2: Supports survey research workflows built around a typed instrument object, the sframe. Features include visual instrument design via a browser-based builder or Shiny, exporting to a self-contained static HTML survey, an embeddable Shinymodule, SHA-256 integrity-checked serialisation, multi-page survey rendering, branching logic, response quality checking, scale scoring, psychometric diagnostics and more. There are seven vignettes including analyzing survey responses and Building a survey instrument.
Time Series
icomb v0.2.0: Implements the Information Combination (IComb) approach proposed by Nguyen, Vahid and Wickramasuriya (2025) for hierarchical forecast reconciliation. The method combines information from base forecasts constructed using different information sets while ensuring coherence. See the vignette.
fable.bayesRecon v0.1.0: Implements probabilistic reconciliation methods within the fable framework for hierarchical time series forecasting following fable conventions. See the vignette for examples and the following for methodological background: Corani et al. (2021), Zambon et al. (2024a), Zambon et al. (2024b), and Carrara et al. (2025).

mixtime v0.1.0: Provides flexible time classes for time series analysis and forecasting with mixed temporal granularities. Supports linear and cyclical time representations in discrete and continuous forms, with timezone support, across multiple calendar systems, including Gregorian and ISO week date calendars. Calendrical arithmetic enables conversion between time granules (e.g., days to months) and calendar systems. Multi-unit arithmetic allows for temporal analysis with other granules of common calendars. Time vectors of different granularities (e.g., monthly and quarterly) can be combined in a single vector. See the vignettes Extending mixtime and Time format strings.
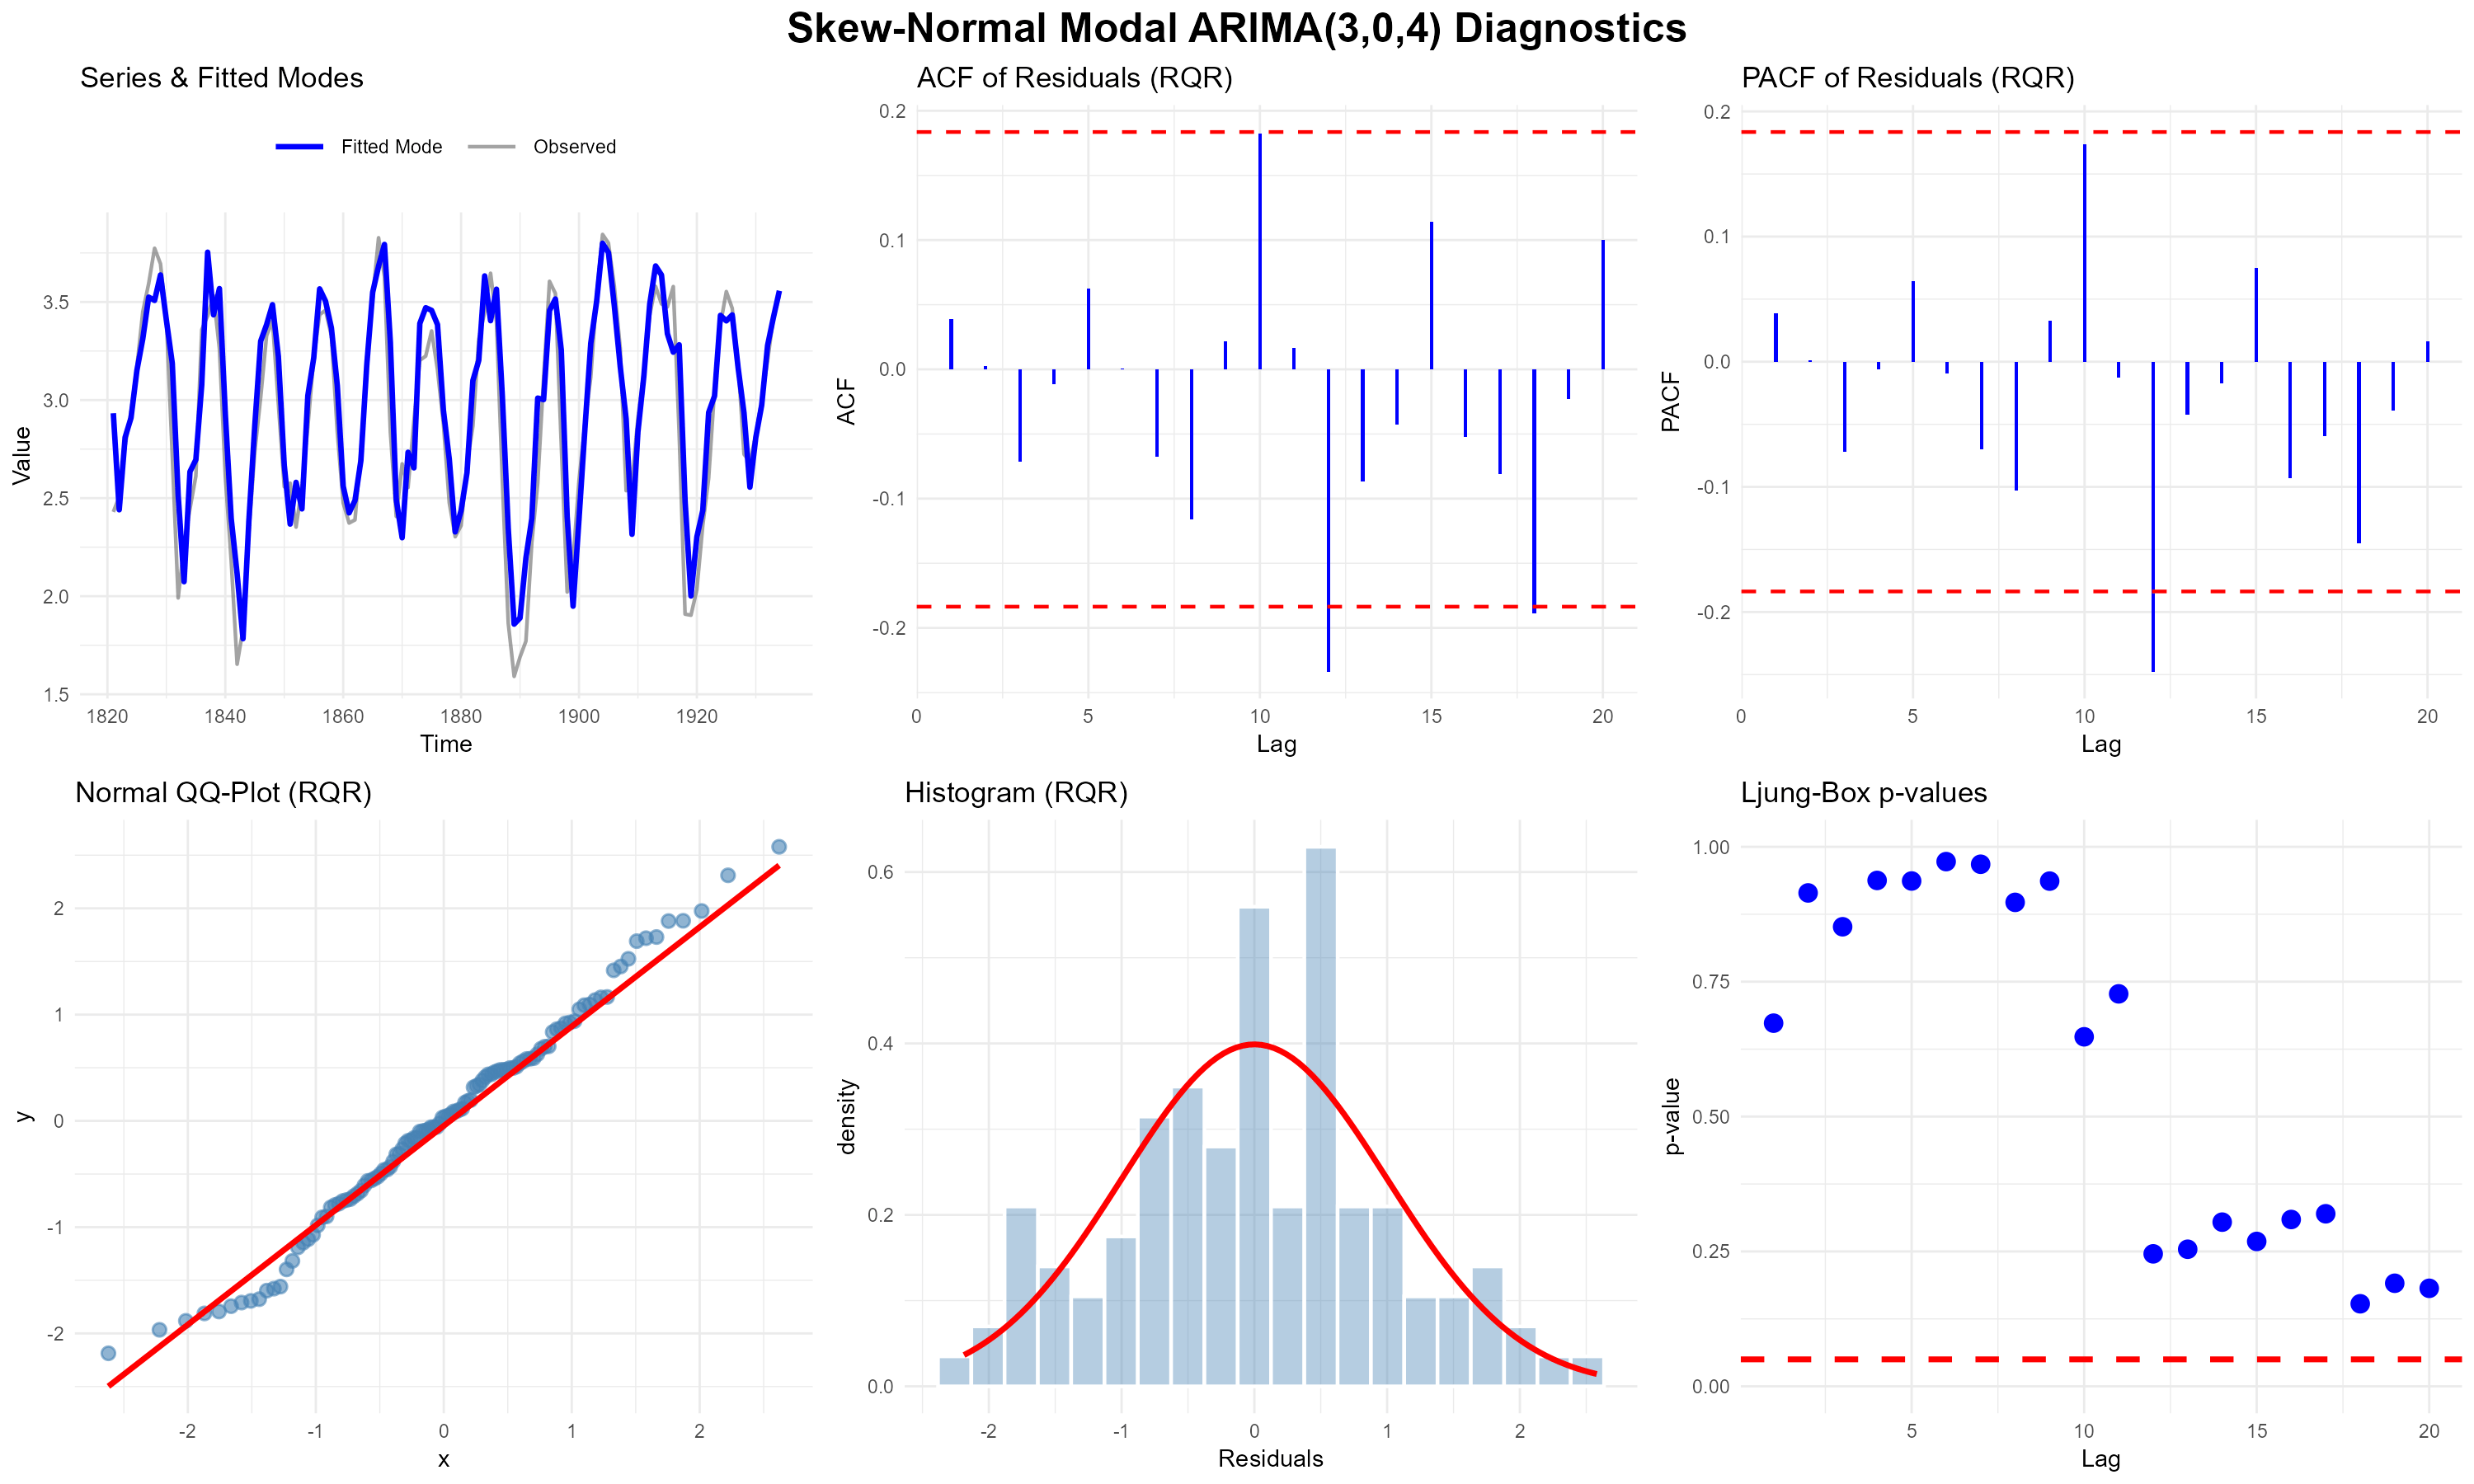
ModalForecast v0.1.0: Implements parametric modal Autoregressive Integrated Moving Average (ARIMA) models utilizing the Skewed Distribution family. Supported distributions include the Skew-Normal, Skewed Student-t, and Skewed Laplace. Features include comprehensive residual diagnostics, robustness options (heavy tails, asymmetry), robust parametric bootstrap prediction intervals, and classical asymptotic inference via the Fisher Information matrix. Methods are described in Galarza et al. (2017). Look here for an example.
VARcheck v0.1.0: Provides model-agnostic visual diagnostics for vector autoregressive models. Given empirical data, model predictions, residuals, and optionally simulated data, the package assembles a multi-panel diagnostic grid: empirical vs. predicted time series, residual inspection, residuals vs. predictions scatter, and posterior predictive style checks via simulated trajectories. See Haslbeck et al. (2026) for the approach followed and the vignettes Example analyses and Getting Started.

Utilities
DT2 v0.1.2: Implements a modern R binding for DataTables V2 with modular extension loading, Bootstrap 5 styling, Shiny integration (proxy, events, inline inputs), server-side processing helpers, and standalone support. Configure DataTables options directly via R lists, a 1:1 mapping to the JavaScript API. There are five vignettes, including Getting Started and Shiny Integration.
gridmicrotex v0.0.4: Provides functions to render LaTeX math equations as native R grid graphics objects (grobs) using the MicroTeX C++ library as the layout engine. Produces resolution-independent vector output that works on any R graphics device, with no external LaTeX installation required. See the vignettes Introduction and Using LaTeX Math in ggplot2.

Visualization
ggsql v0.3.3: Provides functions to write queries that combine SQL (Structured Query Language) data retrieval with visualization specifications in a single, composable syntax, binds directly with the ggsql Rust library, and offers knitr and Shiny integration. See the vignettes Getting started and The ggsql knitr engine.
mSigPlot v2.0.38: Provides plotting functions for mutational signatures and mutational spectra, including single base substitutions, doublet base substitutions, and small insertions and deletions. Generates plots similar to those used previously in Alexandrov et al. (2020) and Rozen et al. (2026). See the vignette for an example.

R-bloggers.com offers daily e-mail updates about R news and tutorials about learning R and many other topics. Click here if you're looking to post or find an R/data-science job.
Want to share your content on R-bloggers? click here if you have a blog, or here if you don't.