

Want to share your content on R-bloggers? click here if you have a blog, or here if you don't.
Stanislaw Ulam, Los Alamos, 1963 was bored in a meeting and he started dooddling integers in a spiral and circled the primes. Diagonal lines appeared. He later showed it to Martin Gardner, to Ulam surprise, Gardner published his findings in Scientific American. We are still confused to this day.
But Ulam was not doodling some little houses or boats, or cars like a normal person. No. He wrote numbers in a spiral. Then circled all the prime numbers. Then stared at what he had created with the dawning horror of a man who has seen too much.
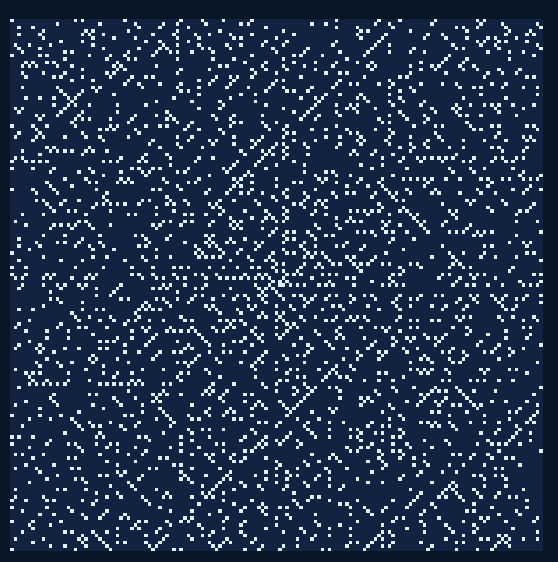
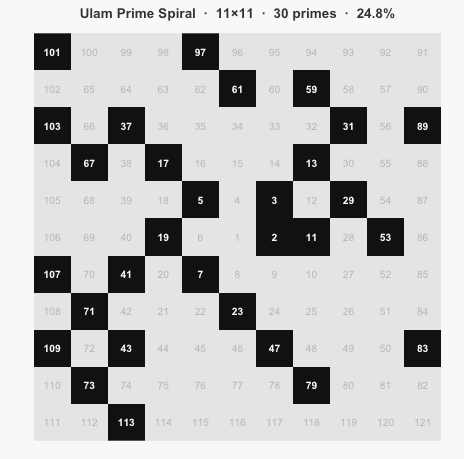
So where does the spiral comes from? Start with 1 in the middle. Write the number in a spiral outward. And then highlight all the prime numbers. If you draw long enough diagonal lines will appear.

Primary function has initial position and directions calculated, in order to have the symmetry of the plot.
ulam_prime_spiral <- function(
    n         = 51,
    theme     = c("Cosmic","Blueish","Classy","Psycho"),
    show_nums = FALSE,   # print values (n ≤ 21 only)
    animate   = FALSE,
    speed     = 1,
    verbose   = TRUE
) {

  theme <- match.arg(theme)

  #n must be odd so integers have a unique centre cell
  if (n %% 2 == 0) { n <- n + 1L }
  if (n < 5) stop("Size muste be > 5.")
  total <- n^2
  mid   <- (n + 1L) / 2L

  dr <- c( 0L, -1L,  0L,  1L)   # row deltas:  E  N  W  S
  dc <- c( 1L,  0L, -1L,  0L)   # col deltas:  E  N  W  S

  mat   <- matrix(0L, n, n)
  ord_r <- integer(total)
  ord_c <- integer(total)

  r <- mid;
  cc <- mid

  mat[r, cc] <- 1L
  ord_r[1]   <- r
  ord_c[1]   <- cc

  d    <- 1L  # current direction index (1=E 2=N 3=W 4=S)
  step <- 1L  # current arm length
  num  <- 2L

  while (num <= total) {
    for (half in 1:2) {          # each dir is twice
      for (i in seq_len(step)) {
        r  <- r  + dr[d]
        cc <- cc + dc[d]
        mat[r, cc] <- num
        ord_r[num] <- r
        ord_c[num] <- cc
        num <- num + 1L
        if (num > total) break
      }
      d <- (d %% 4L) + 1L       # turn left: E→N→W→S→E
      if (num > total) break
    }
    step <- step + 1L
  }
and we determine the prime:
# Sieve of Eratosthenes
  is_prime    <- rep(TRUE, total)
  is_prime[1] <- FALSE
  p <- 2L
  while (p * p <= total) {
    if (is_prime[p])
      is_prime[seq.int(p * p, total, p)] <- FALSE
    p <- p + 1L
  }

  prime_mat <- matrix(is_prime[mat], n, n)
  n_primes  <- sum(prime_mat)
  density   <- 100 * n_primes / total
With for type of visuals (Classy, Psycho, Blueish and Cosmic), if you decide to create a grid smaller than 21×21, you can have also the numbers displayed. And of course, the diagonals are visible as well:
As always, the complete code is available on GitHub in Useless_R_function repository. The complete version of code is here: https://github.com/tomaztk/Useless_R_functions/blob/main/functions/ulam_spiral.R
Check the repository for future updates!
Stay healthy and happy R-coding!
R-bloggers.com offers daily e-mail updates about R news and tutorials about learning R and many other topics. Click here if you're looking to post or find an R/data-science job.
Want to share your content on R-bloggers? click here if you have a blog, or here if you don't.