

Want to share your content on R-bloggers? click here if you have a blog, or here if you don't.

At the 2023 R/Basel event, we noticed a number of speakers and participants who were keen to share or gather knowledge about the use of R and Shiny technologies in many diverse processes of the pharmaceutical industry. From ShinyConf to event’s like useR!’s R/Basel, professionals in the pharmaceutical and biotech industries are expressing their interest and use for R open source.
Our very own André Veríssimo gave an excellent presentation on how open-source technologies, particularly those that use R and Shiny, are transforming the pharmaceutical Industry.
You can watch his presentation below to get the latest insights on how open-source R and Shiny are transforming this industry.
Jump to sections:
- Appsilon’s Open Source for the Pharmaceutical Industry
- R Open Source for Regulatory Compliance
- R Shiny for Pharmaceutical Research and Development
- Infectious Diseases and Public Health Shiny Dashboards
Open Source is Dominating Software
Open source is everywhere these days, and when examining commercial code bases, it’s evident that at least three-quarters of them incorporate open-source elements.
“The future is not only open source, but there is no future without it.” – André Veríssimo
Appsilon’s origins lie in the realm of open source. In our early days, we developed Shiny dashboards and the tools necessary to support them. The community’s enthusiastic adoption of our work provided significant inspiration and momentum, prompting us to increase our contributions.
We maintain a substantial collection of R packages dedicated to enhancing the Shiny user and developer experience. Each of our packages come with documentation to provide an overview of their functionality and how to get started (e.g. Rhino framework documentation) and are continually seeking additional contributions or unique tutorials (e.g. automating End-to-End Cypress tests for Shiny).
R and Shiny Open Source for the Pharmaceutical Industry (by Appsilon)
The pharmaceutical industry is making substantial contributions to open source materials. There is significant potential for the advancement of these R packages, which can greatly influence the way industry-specific processes are conducted.
While this software is gaining widespread adoption, there remains substantial work ahead to fully extend and standardize open-source solutions.
Let’s explore some interesting open-source applications and R packages that we have developed here at Appsilon for the pharmaceutical industry.
R Open Source for Regulatory Compliance
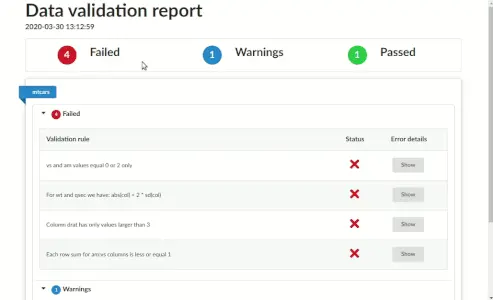
R Package for Data Validation and Automation
The data.validator is a package for scalable and reproducible data validation. It provides:
- Functions for validating datasets in
%>%pipelines:validate_if,validate_colsandvalidate_rows - Predicate functions from the assertr package, like
in_set,within_bounds, etc. - Functions for creating user-friendly reports that you can send to email, store in the logs folder, or generate automatically with RStudio Connect.

FDA Pilot App in Rhino
This application is intended for a pilot submission to the FDA composing of a Shiny application, as part of the R Submissions Working Group Pilot 2. The data sets and results displayed in the application originate from the Pilot 1 project.
Interact with the application through our demonstration website.
We built this application using our Rhino framework to incorporate enterprise features.
R Shiny for Pharmaceutical Research and Development
DepMapV2 – Interactive Data Exploration Shiny App
We have developed this application to facilitate the exploration of the relationship between gene expressions and copy number variations (CNVs).
Interact with the application through our demonstration website.


CNVs are DNA segments that can lead to activation of oncogenes and inactivation of tumor suppressor genes in cancers. CNVs can effectively affect gene expression and are related to the susceptibility of diseases. Several studies have shown that a duplication or deletion of CNVs affects the expression of genes and cancer-related biologic processes.
This app uses the DepMap Public 23Q2 dataset from the DepMap project. This release contains data from CRISPR knockout screens from project Achilles, as well as genomic characterization data from the CCLE project.
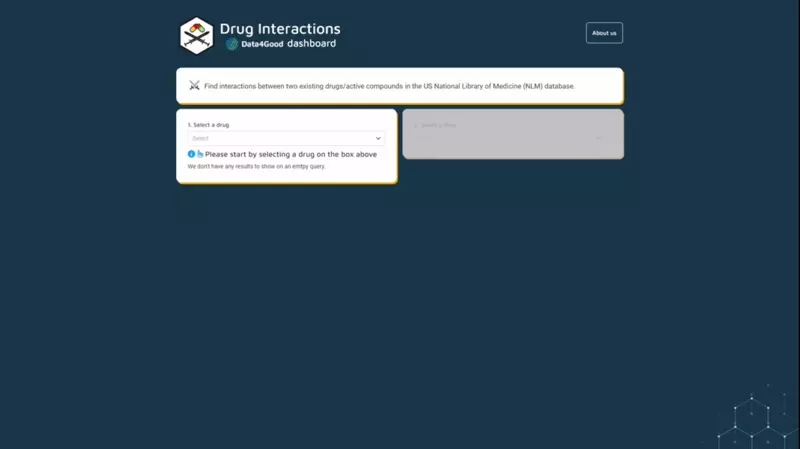
Drug Interactions Shiny App and Database Connections
With this application you can find interactions between two existing drugs/active compounds in the US National Library of Medicine (NLM) database.
Interact with the application through our demonstration website.
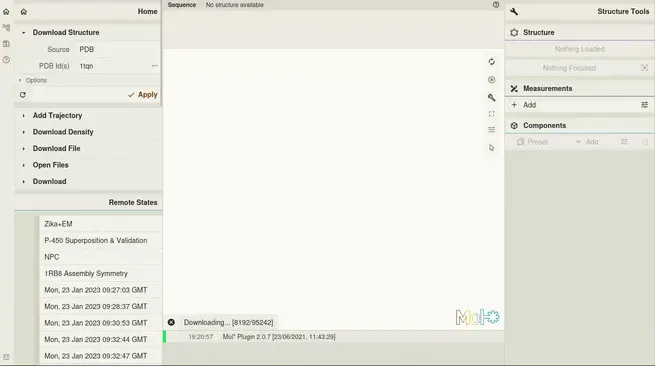
Large-scale Molecular Data Visualization with shiny.molstar
We created an R Shiny wrapper based on shiny.react and molstar-react (node.js library) that gives all the powerful tools of the Mol* open-source toolkit for visualization and analysis of large-scale molecular data.
This package exports three new components that can be used in a Shiny application.
- Molstar creates a Molstar visualization of a protein using an URL to a valid file type supported by Molstar or a “Protein Data Bank” id (pdbId). See more below for available databases to find a valid pdbId.
- AlphaFoldMolstar similar to the Molstar component, but uses the UniProt id in the AlphaFold database to display the protein.
- AlphaFoldDetails creates a component that retrieves details of an AlphaFold protein id (title, download links and a Predict Aligned Error image)
Learn more about this R package on our recent blog post: Introducing shiny.molstar for Large Molecular Structures Visualization in R.

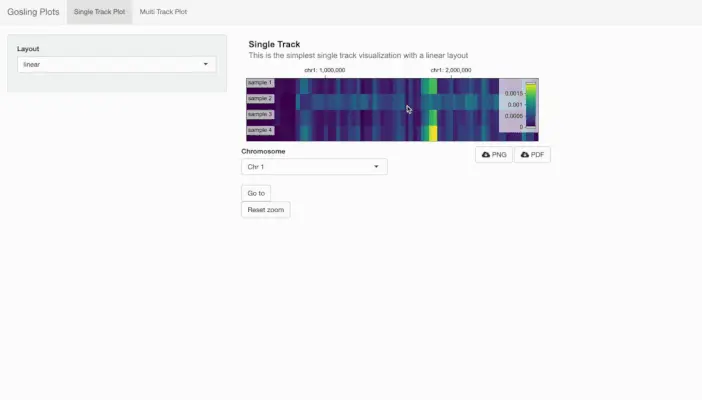
Interactive Genomics Data Visualizations with shiny.gosling
This package is an R Shiny implementation of the Gosling.js library. Gosling js is a highly expressive library based on a Grammar for scalable and interactive Genomics Data visualization. This library is built upon the React wrapper of the Gosling.js. Which is powered by shiny.react. Thus most of the Charts can be directly built using this package.
Learn more about this R package on our recent blog post: Shiny.gosling Examples and How to Run Them: Genomics Visualizations in R Shiny.

Infectious Diseases and Public Health Shiny Dashboards
Johns Hopkins Lyme Disease Dashboard
This is an award-winning interactive data explorer that effectively and carefully showcases Lyme and other tick-borne diseases in the United States.
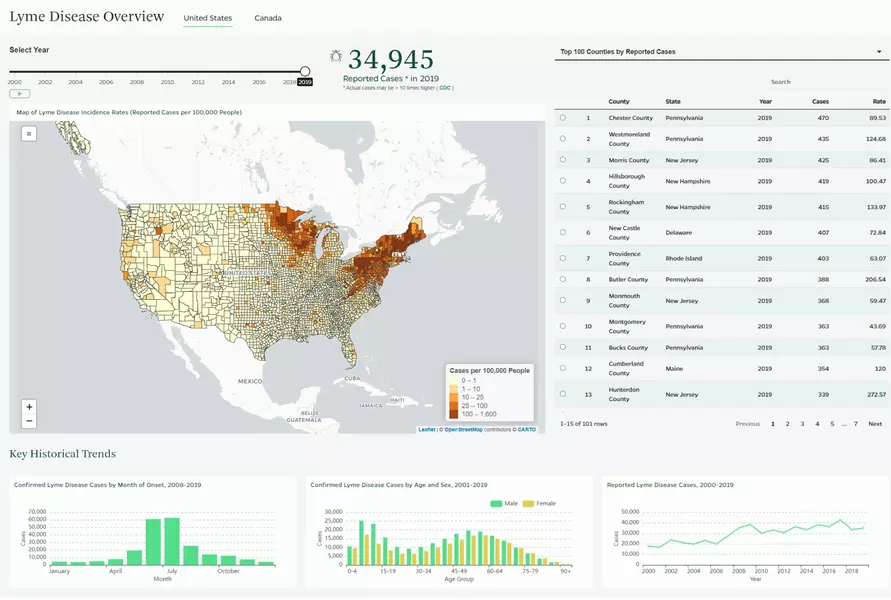

This dashboard was developed due to a critical need for tools that communicate the magnitude of the incidence of Lyme and other tick borne diseases in the United States.
The Dashboard was an initiative led by the Johns Hopkins Spatial Science for Public Health Center, in collaboration with the Johns Hopkins Medical Lyme Disease Research Center and the Johns Hopkins Lyme and Tick Borne Diseases Research and Education Institute.
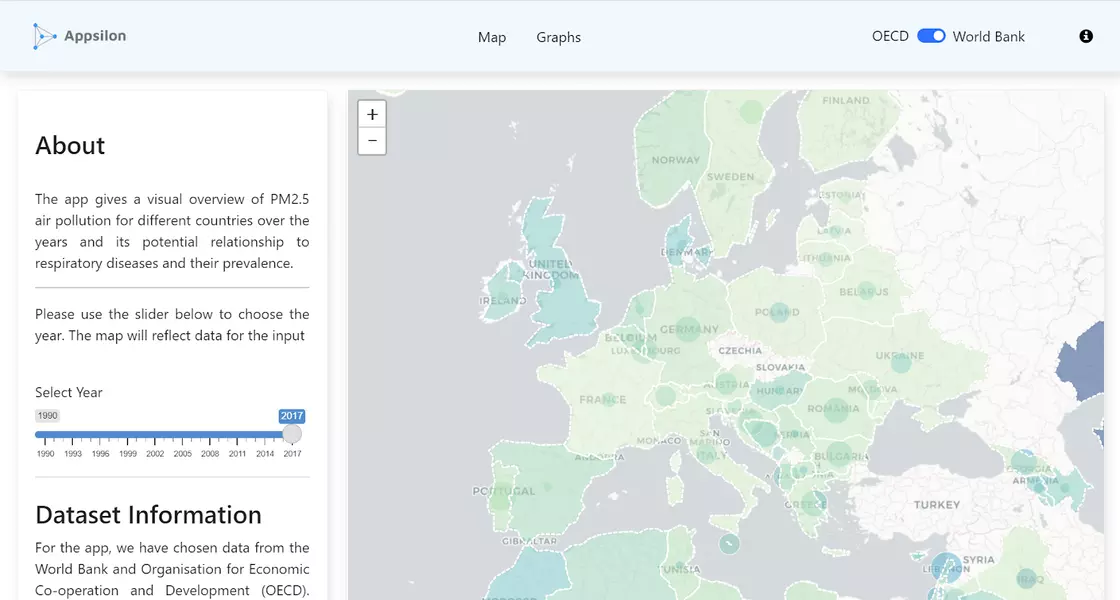
Respiratory Diseases (R Shiny)
This is an app for visualizing global correlations between human mortality rates and a common cause. Respiratory Diseases was created as part of our Data4Good (D4G) initiative.
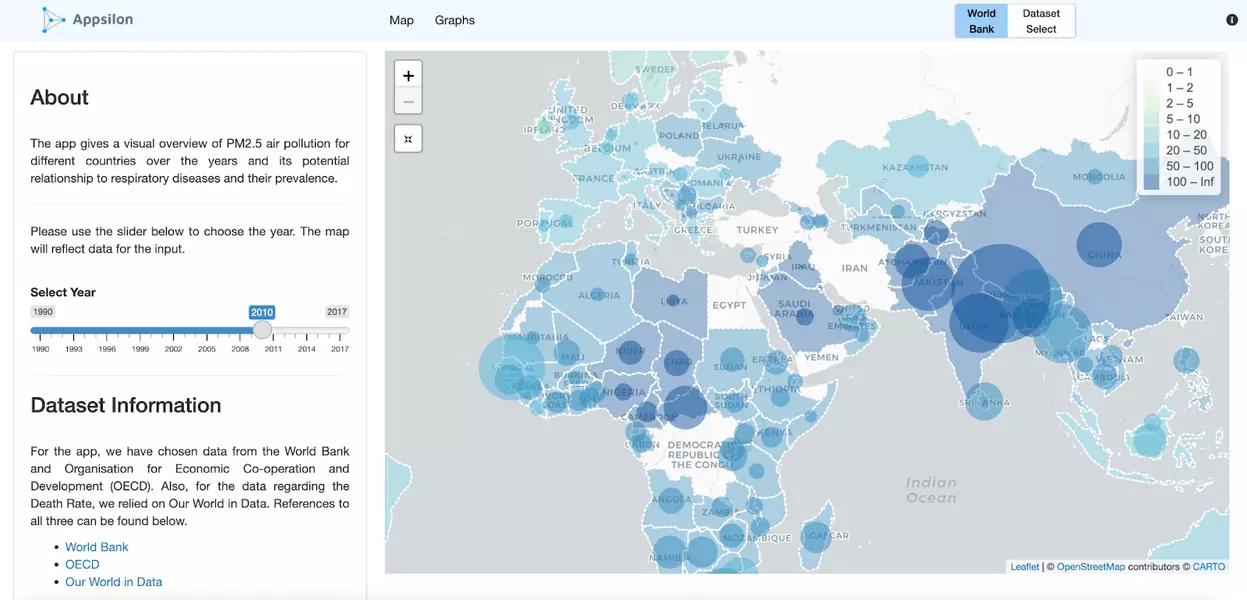

Air pollution is an increasing problem for the world. With this application, we explore the relationship between the PM2.5 particulate metric and the Death Rate (defined as deaths per 100,000) from respiratory illnesses across the world over the years.
The data used in the visualizations comes from the World Bank and Organization for Economic Cooperation and Development (OECD). The death-rate data was collected from the Our World in Data database.
Learn more about Air Quality and Respiratory Diseases visualizations and the challenges with mixing data sources at: Air Quality VS Respiratory Diseases Dashboard: Shiny as a Powerful Tool for Data-Driven Insights.
Respiratory Diseases (Python Shiny)
This is one of the first Shiny for Python apps ever built. It uses the Respiratory Disease App (R Shiny) as a guide. The datasets used for the visualizations come from the same sources as for the previous app.
You can learn more about this application and its applications from an R Shiny developers’ perspective on this blog post: PyShiny Demo: An R Shiny Developer’s thoughts on Shiny for Python.

Interactive Mapping for COVID-19 Public Policy
During the COVID-19 pandemic the tools to explore, visualize and analyze the data were lacking. Organizations and governments need a fast paced way to understand the development process of the disease.
During the pandemic event, we were approached by the IIASA (The International Institute for Applied Systems Analysis) to create an interactive map to visualize COVID-19 data. The map that we developed used Python and Svelte. The application is available to explore here.
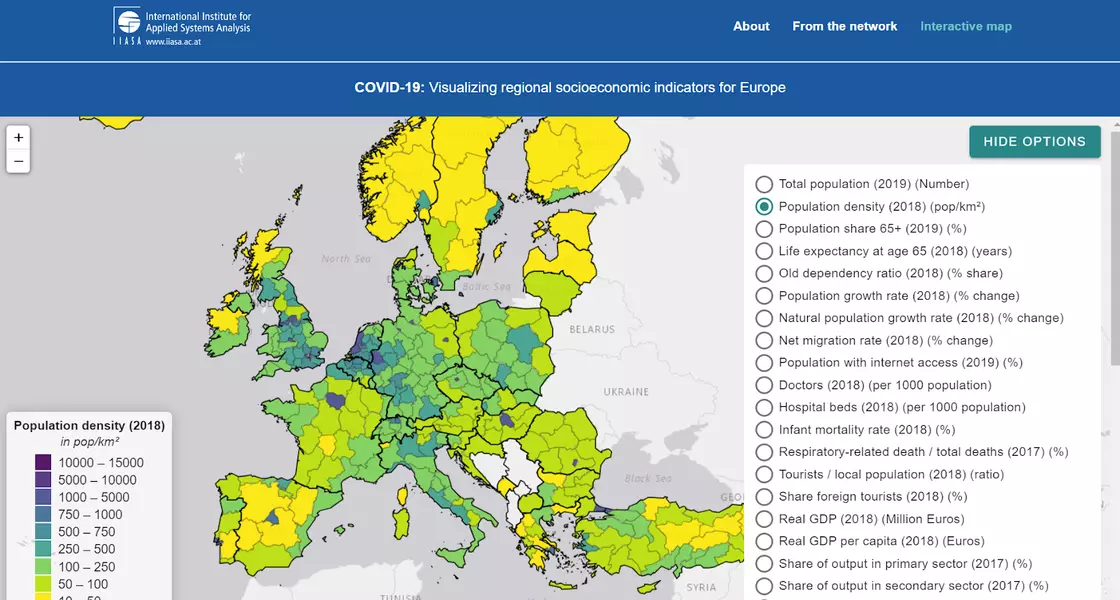
The application allows users to browse through a list of 32 indicators and visualize them on an interactive map.
To learn more about this collaboration and the application that we developed, visit our blog post: IIASA Collaboration: An Interactive Map for COVID-19 Public Policy Decisions.
Appsilon Case Studies for Life Science Projects
Our collaborations with global pharmaceutical companies have yielded impressive outcomes. Here, we share some standout success stories, offering a firsthand look at how our joint efforts have transformed these companies and driven impressive results.
- Unlocking Pharma Insights: Shiny Solutions for Data Optimization
- Impacting Biotech Supply Chains: Empowering Planners with Shiny
Collaborating to Create Open Source Innovations for Life Sciences
Our mission is clear: we want to foster innovation that makes a difference. We use the most advanced machine learning algorithms, visualization techniques, and modern technologies to accelerate the innovation processes of pharmaceutical industries at every stage of drug discovery and development. We marry domain expertise with technical expertise, to create projects that focus on adoption and impact. We partner with teams to innovate and advance the life sciences.
Our valued partnerships with industry-leading pharmaceutical firms are a testament to our commitment to success. Reach out, and together, we can drive impactful change.
The post appeared first on appsilon.com/blog/.
R-bloggers.com offers daily e-mail updates about R news and tutorials about learning R and many other topics. Click here if you're looking to post or find an R/data-science job.
Want to share your content on R-bloggers? click here if you have a blog, or here if you don't.