

Want to share your content on R-bloggers? click here if you have a blog, or here if you don't.


In this post, we’re going to cover how to plot XGBoost trees in R. XGBoost is a very popular machine learning algorithm, which is frequently used in Kaggle competitions and has many practical use cases.
Let’s start by loading the packages we’ll need. Note that plotting XGBoost trees requires the DiagrammeR package to be installed, so even if you have xgboost installed already, you’ll need to make sure you have DiagrammeR also.
# load libraries
library(xgboost)
library(caret)
library(dplyr)
library(DiagrammeR)
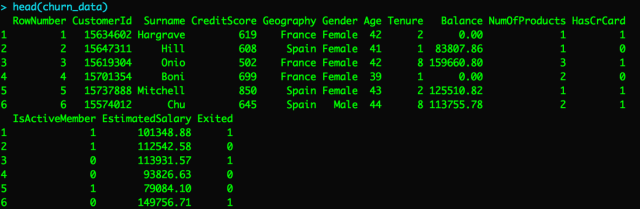
Next, let’s read in our dataset. In this post, we’ll be using this customer churn dataset. The label we’ll be trying to predict is called “Exited” and is a binary variable with 1 meaning the customer churned (canceled account) vs. 0 meaning the customer did not churn (did not cancel account).
# read in dataset
churn_data <- read.csv("Churn_Modelling.csv")

Preparing the dataset for modeling
Now, let’s prep our dataset for modeling. First, we’ll remove a few variables we don’t need. Second, we’ll one hot encode each of the categorical variables. Then, we’ll split our dataset into train and validation.
# remove variables we won't be using for modeling
need_data <- churn_data %>% select(-RowNumber, -CustomerId, -Surname)

# one hot encode all categorical variables
dummy <- dummyVars(" ~ .", data = need_data)
need_data <- data.frame(predict(dummy, newdata = need_data))

y_label <- need_data$Exited
need_data <- need_data %>% select(-Exited)
need_data <- data.frame(Exited = y_label, need_data)

# convert Exited column to a factor
need_data$Exited <- as.factor(need_data$Exited)

# split data into train / validation
set.seed(0)
indexes <- sample(1:nrow(need_data), 0.7 * nrow(need_data))

train_data <- need_data[indexes,]
val_data <- need_data[-indexes,]
Train the XGBoost model
For the purpose of this article, we’ll just vary a few of the hyperparameters using a grid search.
# create tuning grid
grid_default <- expand.grid(nrounds = c(50, 75, 100, 150, 200, 250),
                            max_depth = c(2, 3, 4, 5),
                            eta = c(0.05, 0.1, 0.15),
                            gamma = c(0),
                            colsample_bytree = c(0.7),
                            min_child_weight = c(5),
                            subsample = c(0.6))

# set random seed
set.seed(1234)

# train XGBoost model
xgb_model <- train(formula(need_data),
                   data = need_data,
                   tuneGrid = grid_default,
                   method = "xgbTree",
                   metric = "Kappa")
Plotting XGBoost trees
Now, we’re ready to plot some trees from the XGBoost model. We’ll be able to do that using the xgb.plot.tree function. Let’s plot the first tree in the XGBoost ensemble. Note that in the code below, we specify the model object along with the index of the tree we want to plot.
# plot the first tree
xgb.plot.tree(model = xgb_model$finalModel, trees = 1)


From the plot, we can see that Age is used to make the first split in the tree.
If we want to plot another tree, we can just change the tree index. For example, the line of code below plots the second tree in the XGBoost ensemble.
xgb.plot.tree(model = xgb_model$finalModel, trees = 2)


If you want to adjust the height and width of the plot, you can do that by changing the plot_height and plot_width parameters:
xgb.plot.tree(model = xgb_model$finalModel, trees = 1, plot_width = 1000, plot_height = 1000)
Exporting tree plots to a file
Plots can also be exported programmatically using the export_graph function. Note that to do this, you’ll need to set render = FALSE in the xgb.plot.tree function.
# create plot object of XGBoost tree
tree_plot <- xgb.plot.tree(model = xgb_model$finalModel, trees = 1, plot_width = 1000,
                           plot_height = 1000, render = FALSE)

# export plot object to file
export_graph(tree_plot, "xgboost_tree_plot.pdf", width = 1000, height = 1000)
Plotting multiple trees at once
Rather than plotting a single tree, you can also plot multiple trees at once. You just need to pass a vector of which trees you’d like to plot. For example, the code below will plot the first three trees.
xgb.plot.tree(model = xgb_model$finalModel, trees = 1:3)
Conclusion
That’s it for now. If you liked this post, consider making a contribution to my blog here. Check out my other R posts by clicking this link.
The post How to plot XGBoost trees in R appeared first on Open Source Automation.
R-bloggers.com offers daily e-mail updates about R news and tutorials about learning R and many other topics. Click here if you're looking to post or find an R/data-science job.
Want to share your content on R-bloggers? click here if you have a blog, or here if you don't.