

Want to share your content on R-bloggers? click here if you have a blog, or here if you don't.
The Olympics is an interesting competition for soccer fans: it has the characteristics of both a big tournament like the World Cup and a smaller showcase for young players. The quality of play is often top class and the excitement can be very high, but it’s ultimately a chance for newcomers to show their talent in their national team.
Kaggle’s Olympics History dataset contains an array of information on the sporting event, going back to Athens 1896. For the purpose of this analysis, I looked specifically at soccer players who participated at the Olympics and decided to analyze the change in players’ average age over the last 120 years.
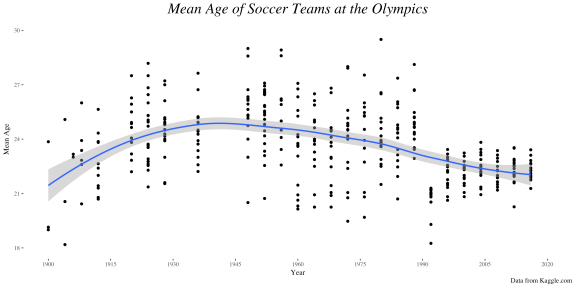

The data shows an increase in age until the mid-20th century, a slight decrease over the next 40 years, and a more significant decrease starting in the 1990s. Further research shows that in 1992 a restriction of 23 years old was put in place. Teams from then on have been restricted to only three players over the age of 23, which explains the larger drop at the end of the 20th and early 21st century.
To better visualize the change over time, I have used a LOESS (Locally Weighted Scatter-plot Smoother) model, which allows for a smooth curve that combines both linear least-squares and nonlinear regression.
A few interesting insights:
- Norway’s 1952 Olympics team was the oldest ever, at an average age of 30.2 years old.
- The youngest team to every participate the United States’ Christian Brothers’ College-1 squad back in 1904, with an average of 18.2. This team comprised of just 11 players.
- The oldest soccer player to ever feature in the Olympics was Oros Witarsa, an Indonesia goalkeeper, featuring in the 1956 Summer Olympics at the age of 40.
- There have been six 15-year-olds to have played in the Olympics (youngest age): Chirawat Pimpawatin, Chatchai Paholpat (both Thailand, 1958), Samuel Osei Kuffour (Ghana, 1992), Abdel-Karim Muhammad Mahmoud Ezzat Sakr (Egypt, 1936), and Louis John Menges (Christian Brothers College 1- USA, 1904).
- Three teams have fielded over 200 soccer players in the history of the Olympics: Italy (240), USA (205), Brazil (204).
And as I enjoy making animated visualizations, here is a more energetic version of the above graph:

As you can see, the LOESS curve changes shape based on the new data available.
library(dplyr)
library(ggplot2)
library(ggthemes)
library(lubridate)
library(readr)
library(animation)
soccer_olympics <- df %>% filter(Event == "Football Men's Football")


medal_winners <- soccer_olympics %>% filter(Medal %in% c("Gold","Silver", "Bronze"))
medal_winners$Medal <- medal_winners$Medal %>% factor(levels = c("Gold", "Silver", "Bronze"))

age_medal_winners <- medal_winners %>%
  group_by(Team,Games,Year,Medal) %>%
  summarise(mean_age = mean(Age,na.rm = TRUE))

age_medal_winners %>%
  ggplot(aes(x = Year,
             y = mean_age,
             color = Medal)) +
  geom_point()+
  geom_smooth()


age_medal_winners %>%
  ggplot(aes(x = Year,
             y = mean_age,
             color = Medal)) +
  geom_smooth()
And for the animated graph:
saveGIF({
for (i in 1900:2016) {
year_games &lt;- as.character(i)
year_data % filter(Year &lt;= i)
gg %
ggplot(aes(x = Year,
y = mean_age
)) +
geom_point()+
geom_smooth(method = "auto", se = FALSE)+
theme_tufte()+
ggtitle(paste0('Mean Age of Soccer Teams at the Olympics (1900 - ', year_games,")"))+
theme(legend.position="none")+
theme(plot.title = element_text(size = 22,
face= "italic",
hjust = 0.5))+
scale_x_continuous(breaks=seq(1900,2020,10), limits = c(1900,2020))+
scale_y_continuous(breaks=seq(18,30,2), limits = c(18,30))+
labs(y = "Mean Age", caption ="Data from Kaggle.com")
print(gg)
}
}, movie.name = 'olympic_team_ages.gif', interval = 0.2, ani.width = 1000, ani.height = 700)
R-bloggers.com offers daily e-mail updates about R news and tutorials about learning R and many other topics. Click here if you're looking to post or find an R/data-science job.
Want to share your content on R-bloggers? click here if you have a blog, or here if you don't.