

Want to share your content on R-bloggers? click here if you have a blog, or here if you don't.
So the votes are in:
Your established blog is mostly about your work. Your work changes. Do you continue at the current blog or start a new one?
— Neil Saunders (@neilfws) January 23, 2017
I thank you, kind readers. So here’s the plan: (1) keep blogging here as frequently as possible (perhaps monthly), (2) on more general “how to do cool stuff with data and R” topics, (3) which may still include biology from time to time. Sounds OK? Good.
So: let’s use R to analyse data from the iOS Health app.
I own an iPhone. It comes with a Health app installed by default. Not being a big user of mobile apps, it was several months before I opened it and realised that it had been collecting data. Which makes me wonder what else the phone does without my knowledge…but back to the topic. It turns out that health data can be exported by tapping at top-right on the overview page, then choosing export.
Click to view slideshow.This generates a compressed file, ios_health_export.zip. Upload it from your phone to your destination of choice; I went with Google Drive.
Being Apple, I’d assumed that the contents might be some hideous proprietary binary format but in fact unzipping the file reveals a directory, apple_health_export, in which reside two XML files. The larger export.xml contains your health data.
Records in the XML file consist of lines that specify the record type (measurement), source, three timestamps for creation, start and end, and the value of the measurement. Most of my records are step counts, which look like this:
<Record type="HKQuantityTypeIdentifierStepCount" sourceName="Health" unit="count" creationDate="2014-09-24 09:25:06 +1100" startDate="2014-09-23 18:01:22 +1100" endDate="2014-09-23 18:01:24 +1100" value="9"/>
And so to R. In the past I would have used the XML package but in my ongoing effort to convert to the “tidyverse”, I’ll try xml2 instead. We’ll use purrr too for reasons that will become apparent, ggplot2 for plotting and dplyr because it is awesome.
Reading in the file could not be easier:
library(xml2)
library(purrr)
library(ggplot2)
library(dplyr)

health_data <- read_xml("export.xml")
Nor could extracting the records that contain step counts. We use an xpath expression, then pipe the result to purr’s mapping functions to go straight from XML attributes to a data frame, as described here.
steps <- xml_find_all(health_data, ".//Record[@type='HKQuantityTypeIdentifierStepCount']") %>% map(xml_attrs) %>% map_df(as.list)

glimpse(steps)
Observations: 188,677
Variables: 9
$ type          <chr> "HKQuantityTypeIdentifierStepCount", "HKQuantityTypeIdentifierStepCount", "HKQuantityTypeIdentifierStepCount", "HKQuantityTypeIdentifierStepCount", ...
$ sourceName    <chr> "Health", "Health", "Health", "Health", "Health", "Health", "Health", "Health", "Health", "Health", "Health", "Health", "Health", "Health", "Health"...
$ unit          <chr> "count", "count", "count", "count", "count", "count", "count", "count", "count", "count", "count", "count", "count", "count", "count", "count", "cou...
$ creationDate  <chr> "2014-09-24 09:25:06 +1100", "2014-09-24 09:25:06 +1100", "2014-09-24 09:25:06 +1100", "2014-09-24 09:25:06 +1100", "2014-09-24 09:25:06 +1100", "20...
$ startDate     <chr> "2014-09-23 17:58:58 +1100", "2014-09-23 17:59:08 +1100", "2014-09-23 17:59:18 +1100", "2014-09-23 17:59:28 +1100", "2014-09-23 17:59:58 +1100", "20...
$ endDate       <chr> "2014-09-23 17:59:03 +1100", "2014-09-23 17:59:13 +1100", "2014-09-23 17:59:23 +1100", "2014-09-23 17:59:33 +1100", "2014-09-23 18:00:03 +1100", "20...
$ value         <chr> "12", "5", "17", "1", "14", "4", "10", "2", "4", "2", "9", "7", "4", "9", "7", "6", "11", "13", "6", "8", "5", "8", "6", "9", "1", "7", "13", "6", "...
$ sourceVersion <chr> NA, NA, NA, NA, NA, NA, NA, NA, NA, NA, NA, NA, NA, NA, NA, NA, NA, NA, NA, NA, NA, NA, NA, NA, NA, NA, NA, NA, NA, NA, NA, NA, NA, NA, NA, NA, NA, ...
$ device        <chr> NA, NA, NA, NA, NA, NA, NA, NA, NA, NA, NA, NA, NA, NA, NA, NA, NA, NA, NA, NA, NA, NA, NA, NA, NA, NA, NA, NA, NA, NA, NA, NA, NA, NA, NA, NA, NA, ...
To illustrate an example analysis, let’s aggregate steps to a monthly count and plot counts by month. We’ll assume that startDate is a proxy for day (i.e. I’m not walking at midnight so steps don’t straddle day boundaries). We’ll also assign the monthly count to the first day of the month, to avoid having to figure out what number day ends the month 🙂
So, to recode step count as an integer, convert the start date to a date object, summarise by month and plot, let’s see dplyr in action:
steps %>% select(startDate, value) %>%
group_by(Date = as.Date(paste(substr(startDate, 1, 7), "01", sep = "-")))
%>% summarise(count = sum(as.numeric(value))) %>%
ggplot(aes(Date, count)) + geom_col(fill = "skyblue3") + theme_bw() + labs(y = "monthly step count", title = "Steps by month September 2014 - January 2017 as measured by iOS")
Result:
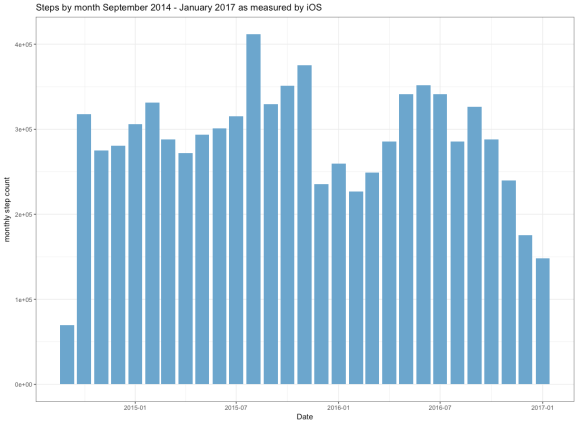

As to how accurate the counts are: that’s for another day.
Filed under: personal, R, statistics, this blog Tagged: health, iOS, parsing, xml


R-bloggers.com offers daily e-mail updates about R news and tutorials about learning R and many other topics. Click here if you're looking to post or find an R/data-science job.
Want to share your content on R-bloggers? click here if you have a blog, or here if you don't.