

Want to share your content on R-bloggers? click here if you have a blog, or here if you don't.
In this post I introduce ‘Inswinger’ an interactive Shiny app to analyze International T20 players, matches and teams. This app was a natural consequence to my earlier Shiny app ‘GooglyPlus’. Most of the structure for this app remained the same, I only had to work with a different dataset, so to speak.
The Googly Shiny app is based on my R package ‘yorkr’ which is now available in CRAN. The R package and hence this Shiny app is based on data from Cricsheet. Inswinger is based on the latest data dump from Cricsheet (Dec 2016) and includes all International T20 till then. There are a lot of new Internationation teams like Oman, Hong Kong, UAE, etc. In total there are 22 different International T20 teams in my Inswinger app.
The countries are a) Afghanistan b) Australia c) Bangladesh d) Bermuda e) Canada f) England g) Hong Kong h) India i) Ireland j) Kenya k) Nepal l) Netherlands m) New Zealand n) Oman o) Pakistan p) Papua New Guinea q) Scotland r) South Africa s) Sri Lanka t) United Arab Emirates u) West Indies v) Zimbabwe
My R package ‘yorkr’, on which both these Shiny apps are based, has the ability to output either a dataframe or plot, depending on a parameter plot=TRUE or FALSE. Hence in the Inswinger Shiny app results can be displayed both as table or a plot depending on the choice of function.
Inswinger can do detailed analyses of a) Individual T20 batsman b) Individual T20 bowler c) Any T20 match d) Head to head confrontation between 2 T20 teams e) All matches of a T20 team against all other teams.
The Shiny app can be accessed at Inswinger
The code for Inswinger is available at Github. Feel free to clone/download/fork the code from Inswinger
Based on the 5 detailed analysis domains there are 5 tabs
A) T20 Batsman: This tab can be used to perform analysis of all T20 batsman. If a batsman has played in more than 1 team, then the overall performance is considered. There are 10 functions for the T20 Batsman. They are shown below
– Batsman Runs vs. Deliveries
– Batsman’s Fours & Sixes
– Dismissals of batsman
– Batsman’s Runs vs Strike Rate
– Batsman’s Moving Average
– Batsman’s Cumulative Average Run
– Batsman’s Cumulative Strike Rate
– Batsman’s Runs against Opposition
– Batsman’s Runs at Venue
– Predict Runs of batsman
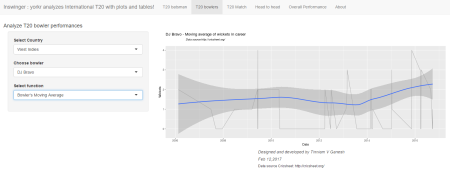
B) T20 Bowler: This tab can be used to analyze individual T20 bowlers. The functions handle T20 bowlers who have played in more than 1 T20 team.
– Mean Economy Rate of bowler
– Mean runs conceded by bowler
– Bowler’s Moving Average
– Bowler’s Cumulative Avg. Wickets
– Bowler’s Cumulative Avg. Economy Rate
– Bowler’s Wicket Plot
– Bowler’s Wickets against opposition
– Bowler’s Wickets at Venues
– Bowler’s wickets prediction
C) T20 match: This tab can be used for analyzing individual T20 matches. The available functions are
– Match Batting Scorecard – Table
– Batting Partnerships – Plot, Table
– Batsmen vs Bowlers – Plot, Table
– Match Bowling Scorecard – Table
– Bowling Wicket Kind – Plot, Table
– Bowling Wicket Runs – Plot, Table
– Bowling Wicket Match – Plot, Table
– Bowler vs Batsmen – Plot, Table
– Match Worm Graph – Plot
D) Head to head: This tab can be used for analyzing head-to-head confrontations, between any 2 T20 teams for e.g. all matches between India vs Australia or West Indies vs Sri Lanka . The available functions are
-Team Batsmen Batting Partnerships All Matches – Plot, Table {Summary and Detailed}
-Team Batting Scorecard All Matches – Table
-Team Batsmen vs Bowlers all Matches – Plot, Table
-Team Wickets Opposition All Matches – Plot, Table
-Team Bowling Scorecard All Matches – Table
-Team Bowler vs Batsmen All Matches – Plot, Table
-Team Bowlers Wicket Kind All Matches – Plot, Table
-Team Bowler Wicket Runs All Matches – Plot, Table
– Win Loss All Matches – Plot
E) T20 team’s overall performance: this tab can be used analyze the overall performance of any T20 team. For this analysis all matches played by this team is considered. The available functions are
-Team Batsmen Partnerships Overall – Plot, Table {Summary and Detailed)}
-Team Batting Scorecard Overall –Table
-Team Batsmen vs Bowlers Overall – Plot, Table
-Team Bowler vs Batsmen Overall – Plot, Table
-Team Bowling Scorecard Overall – Table
-Team Bowler Wicket Kind Overall – Plot, Table
Below I include a random set of charts that are generated in each of the 5 tabs
A. IPL Batsman
a. Shakib-al-Hassan (Bangladesh) : Runs vs Deliveries


b. Virat Kohli (India) – Cumulative Average


c. AB Devilliers (South Africa) – Runs at venues


d. Glenn Maxwell (Australia) – Predict runs vs deliveries faces


B. IPL Bowler
a. TG Southee (New Zealand) – Mean Economy Rate vs overs


b) DJ Bravo – Moving Average of wickets

c) AC Evans (Scotland) – Bowler Wickets Against Opposition


C.T20 Match
a. Match Score (Afghanistan vs Canada, 2012-03-18)


b) Match batting partnerships (Plot) Hong Kong vs Oman (2015-11-21), Hong Kong
Hong Kong Partnerships


c) Match batting partnerships (Table) – Ireland vs Scotland(2012-03-18, Ireland)
Batting partnership can also be displayed as a table


d) Batsmen vs Bowlers (Plot) – India vs England (2012-12-22)


e) Match Worm Chart – Sri Lanka vs Pakistan (2015-08-01)


D.Head to head
a) Team Batsmen Partnership (Plot) – India vs Australia (all matches)
Virat Kohli has the highest total runs in partnerships against Australia


b) Team Batsmen Partnership (Summary – Table) – Kenya vs Bangladesh


c) Team Bowling Scorecard (Table only) India vs South Africa all Matches


d) Wins- Losses New Zealand vs West Indies all Matches


C) Overall performances
a) Batting Scorecard All Matches (Table only) – England’s overall batting performance
Eoin Morgan, Kevin Pieterson & SJ Taylor have the best performance


b) Batsman vs Bowlers all Matches (Plot)
India’s best performing batsman (Rank=1) is Virat Kohli

c) Batsman vs Bowlers all Matches (Table)
The plot above for Virat Kohli can also be displayed as a table. Kohli has score most runs DJ Bravo, SR Watson & Shahid Afridi


The Inswinger Shiny app can be accessed at Inswinger. Give it a swing!
The code for Inswinger is available at Github. Feel free to clone/download/fork the code from Inswinger
Also see my other Shiny apps
1.GooglyPlus
2.What would Shakespeare say?
3.Sixer
4.Revisiting crimes against women in India
You may also like
1. Neural Networks: The mechanics of backpropagation
A primer on Qubits, Quantum gates and Quantum Operation
2. Re-working the Lucy Richardson algorithm in OpenCV
3.Design Principles of Scalable, Distributed Systems
4.Spicing up a IBM Bluemix cloud app with MongoDB and NodeExpress
5.Programming languages in layman’s language
7.Re-introducing cricketr! : An R package to analyze performances of cricketers
To see all posts take at a look at Index of Posts


R-bloggers.com offers daily e-mail updates about R news and tutorials about learning R and many other topics. Click here if you're looking to post or find an R/data-science job.
Want to share your content on R-bloggers? click here if you have a blog, or here if you don't.