

Want to share your content on R-bloggers? click here if you have a blog, or here if you don't.
Recently my student Yingkang Xie and I have developed freqparcoord, a novel approach to the parallel coordinates method for multivariate data visualization. Our approach:
- Addresses the screen-clutter problem in parallel coordinates, by only plotting the “most typical” cases, meaning those with the highest estimated multivariate density values. This makes it easier to discern relations between variables.
- Also allows plotting the “least typical” cases, i.e. those with the lowest density values, in order to find outliers.
- Allows plotting only cases that are “local maxima” in terms of density, as a means of performing clustering.
The user has the option of specifying that the computation be done parallelized. (See http://heather.cs.ucdavis.edu/paralleldatasci.pdf for a partial draft of my book, Parallel Computing for Data Science: with Examples from R and Beyond, to be published by Chapman & Hall later this year. Comments welcome.) For a quick intro to freqparcoord, download from CRAN, and load into R. Type ?freqparcoord and run the examples, making sure to read the comments. One of the examples, whose plot is shown below, involves baseball player data, courtesy of the UCLA Statistics Dept. Here we’ve plotted the 5 most typical lines for each position. We see that catchers tend to be shorter, heavier and older, while pitchers tend to be taller, lighter and younger. 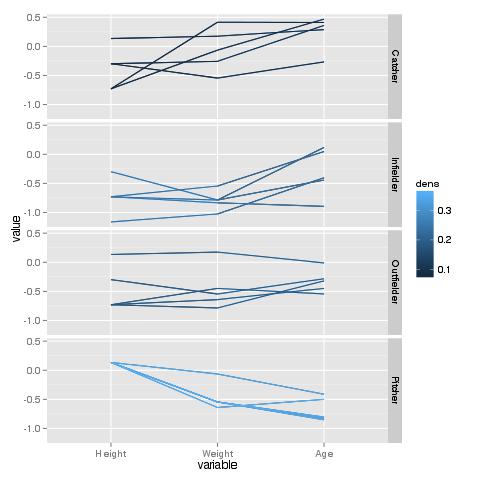


R-bloggers.com offers daily e-mail updates about R news and tutorials about learning R and many other topics. Click here if you're looking to post or find an R/data-science job.
Want to share your content on R-bloggers? click here if you have a blog, or here if you don't.