

Want to share your content on R-bloggers? click here if you have a blog, or here if you don't.
Introduction
Continuing my recent series on exploratory data analysis (EDA), and following up on the last post on the conceptual foundations of empirical cumulative distribution functions (CDFs), this post shows how to plot them in R. (Previous posts in this series on EDA include descriptive statistics, box plots, kernel density estimation, and violin plots.)
I will plot empirical CDFs in 2 ways:
- using the built-in ecdf() and plot() functions in R
- calculating and plotting the cumulative probabilities against the ordered data
Continuing from the previous posts in this series on EDA, I will use the “Ozone” data from the built-in “airquality” data set in R. Recall that this data set has missing values, and, just as before, this problem needs to be addressed when constructing plots of the empirical CDFs.
Recall the plot of the empirical CDF of random standard normal numbers in my earlier post on the conceptual foundations of empirical CDFs. That plot will be compared to the plots of the empirical CDFs of the ozone data to check if they came from a normal distribution.
Method #1: Using the ecdf() and plot() functions
I know of 2 ways to plot the empirical CDF in R. The first way is to use the ecdf() function to generate the values of the empirical CDF and to use the plot() function to plot it. (The plot.ecdf() function combines these 2 steps and directly generates the plot.)
First, let’s get the data and the sample size; note the need to count the number of non-missing values in the “ozone” data vector for the sample size.
### get data and calculate key summary statistics
# extract "Ozone" data vector for New York
ozone = airquality$Ozone
# calculate the number of non-missing values in "ozone"
n = sum(!is.na(ozone))
Now, let’s use the ecdf() function to obtain the empirical CDF values. You can see what the output looks like below.
# obtain empirical CDF values
ozone.ecdf = ecdf(ozone)
> ozone.ecdf
Empirical CDF
Call: ecdf(ozone)
 x[1:67] =      1,      4,      6,  ...,    135,    168
Finally, use the plot() function to plot the empirical CDF.
- Note that only one argument – the object created by ecdf() – is needed.
- Also note my use of the mtext() and the expression() functions to add the desired “F-hat-of-x” label. For some strange reason, the same expression used in the ylab option in the plot() function does not show the “hat”. I’m very glad that mtext() shows the “hat”!
- The ylab option in plot() is set as ‘ ‘ to purposefully show nothing. If the ylab option is not specified,
- Notice that “[n]‘ is used to write “n” as a subscript.

")
### plotting the empirical cumulative distribution function using the ecdf() and plot() functions
# print a PNG image to a desired folder
png('INSERT YOUR DIRECTORY PATH HERE/ecdf1.png')
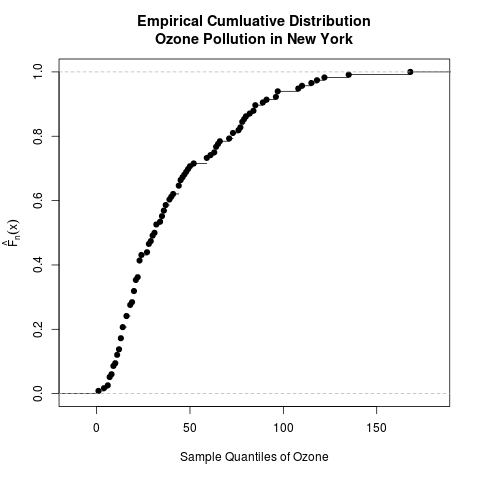
plot(ozone.ecdf, xlab = 'Sample Quantiles of Ozone', ylab = '', main = 'Empirical Cumluative Distribution\nOzone Pollution in New York')
# add label for y-axis
# the "line" option is used to set the position of the label
# the "side" option specifies the left side
mtext(text = expression(hat(F)[n](x)), side = 2, line = 2.5)
dev.off()
# you can create the plot directly with just the plot.ecdf() function, but this doesn't produce any empirical CDF values
Method #2: Plotting the Cumulative Probabilities Against the Ordered Data
There is another way of plotting the empirical CDF that mirrors its definition. It uses R functions to
- calculate the cumulative probabilities
- order the data
- plot the cumulative probabilities against the ordered data.
This method does not use any function specifically created for empirical CDFs; it combines several functions that are more rudimentary in R.
- It plots the empirical CDF as a series of “steps” using the option type = ‘s’ in the plot() function.
- Notice that the vector (1:n)/n is the vector of the cumulative probabilities that are assigned to the data.
- I have also added some vertical and horizontal lines that mark the 3rd quartile; this gives the intution that the CDF increases quickly and that most of the probabilities are already assigned with the small values of the data.
- In case you’re wondering how I got the 3rd quartile, I used the summary() function on the output of the fivenum() function as applied to the ozone data.
summary(fivenum(ozone))
> summary(fivenum(ozone))
   Min.    1st Qu.   Median    Mean     3rd Qu.    Max.
   1.0     18.0      31.5      56.4     63.5       168.0

### empirical cumulative distribution function using sort() and plot()

# ordering the ozone data
ozone.ordered = sort(ozone)

png('INSERT YOUR DIRECTORY PATH HERE/ecdf2.png')

# plot the possible values of probability (0 to 1) against the ordered ozone data (sample quantiles of ozone)
# notice the option type = 's' for plotting the step functions
plot(ozone.ordered, (1:n)/n, type = 's', ylim = c(0, 1), xlab = 'Sample Quantiles of Ozone', ylab = '', main = 'Empirical Cumluative Distribution\nOzone Pollution in New York')

# mark the 3rd quartile
abline(v = 62.5, h = 0.75)

# add a legend
legend(65, 0.7, '3rd Quartile = 63.5', box.lwd = 0)

# add the label on the y-axis
mtext(text = expression(hat(F)[n](x)), side = 2, line = 2.5)

dev.off()

Did the Ozone Data Come from a Normal Distribution?
Recall the empirical CDF plot of the random standard normal numbers from my last post on the conceptual foundations of empirical CDFs.

Comparing this above plot to the plots of the empirical CDFs of the ozone data, it is clear that the latter do not have the “S” shape of the normal CDF. Thus, the ozone data likely did not come from a normal distribution.
Filed under: Applied Statistics, Descriptive Statistics, Plots, R programming Tagged: abline(), airquality, cdf, cumulative distribution function, data, data analysis, ecdf(), empirical cdf, empirical cumulative distribution function, expression(), goodness of fit, legend(), missing data, missing values, mtext(), normal distribution, ozone, plot, plot.ecdf(), plots, plotting, quantile, quantiles, quartile, quartiles, R, R programming, standard normal distribution, statistics, subscript


R-bloggers.com offers daily e-mail updates about R news and tutorials about learning R and many other topics. Click here if you're looking to post or find an R/data-science job.
Want to share your content on R-bloggers? click here if you have a blog, or here if you don't.