
Use box plots to assess the distribution and to identify the outliers in your dataset
Want to share your content on R-bloggers? click here if you have a blog, or here if you don't.
After you check the distribution of the data by ploting the histogram, the second thing to do is to look for outliers. Identifying the outliers is important becuase it might happen that an association you find in your analysis can be explained by the presence of outliers.
The best tool to identify the outliers is the box plot. Through box plots we find the minimum, lower quartile (25th percentile), median (50th percentile), upper quartile (75th percentile), and maximum of an continues variable. The function to build a boxplot is boxplot().
Let see this example:
# load data
data("iris")

names(iris)
"Sepal.Length" "Sepal.Width"  "Petal.Length" "Petal.Width"  "Species"

# build the box plot
boxplot(iris$Sepal.Length, main="Box plot", ylab="Sepal Length")
This will generate the following box plot. Each horizontal line starting from bottom will show the minimum, lower quartile, median, upper quartile and maximum value of Sepal.Length.

We can use box plot to explore the distribution of a continues variable accross the strata. I’m saying strata becuase the variable should be categorical. For example you want to see what is the distribution of age among individuals with and without blood pressure. In the example below, I’m showing the length of sepal in different species.
# load data
data("iris")

# names of variables
names(iris)
"Sepal.Length" "Sepal.Width"  "Petal.Length" "Petal.Width"  "Species"

# build the box plot
boxplot(Sepal.Length ~ Species, data=iris,
     main="Box Plot",
     xlab="Species",
     ylab="Sepal Length")
This will generate the following box plots:
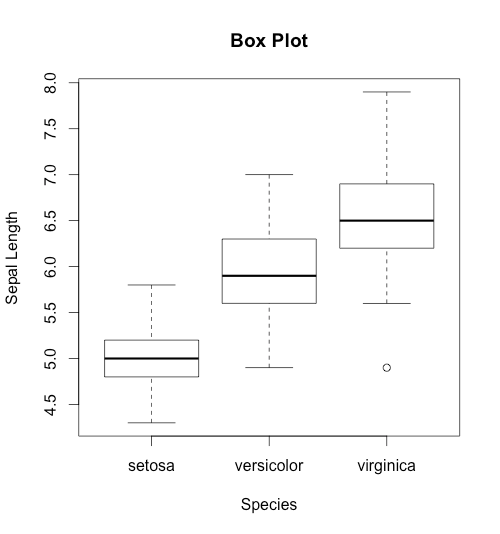
If you look at the bottom of third box plot you will find an outlier. If you find in your dataset an outlier I suggest to remove it. Although, to remove an outlier should be a topic of another post, for now you can check your dataset and manually remove the observation. However, there are functions which remove outliers automatically.
Feel free to post comments if you have any question.
R-bloggers.com offers daily e-mail updates about R news and tutorials about learning R and many other topics. Click here if you're looking to post or find an R/data-science job.
Want to share your content on R-bloggers? click here if you have a blog, or here if you don't.