
The hockeystick revisited
Want to share your content on R-bloggers? click here if you have a blog, or here if you don't.
Previous posts:
Correlation of temperature proxies with observations
The “best” proxies for temperature reconstruction
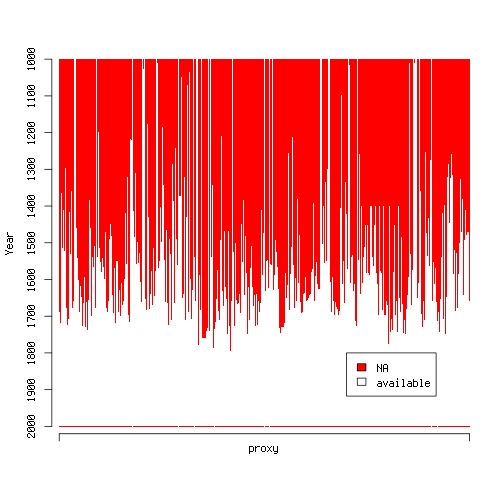
Okay, I couldn’t resist. I wanted to provide some more in depth analysis of temperature proxies, but I just went ahead and did my own little reconstruction of Northern hemisphere annual average temperatures over the past millenium using McShane et al.‘s (2011) data. First of all, look at the following plot:
produced by this R code:
##this R script produces an image which inicates that
##proxy x at year y is NA by a red dot at (x,y)
#load the data
load("../data/data_allproxy1209.Rdata")
load("../data/data_instrument.Rdata")
t.nh <- instrument$CRU_NH_reform
allproxy1209 <- allproxy1209[,-c(1,grep("lutannt",names(allproxy1209)))]
na.mat <- is.na(allproxy1209)*1

##plot
#open device
jpeg(file="na.plot.jpg",width=500,height=500,quality=100)
#plot NA-matrix red-white coded
image(t(na.mat[paste(seq(2000,1000)),]),col=c("white","red"),breaks=c(-.5,.5,1.5),axes=F)
#some axes and text
axis(side=2,at=seq(0,1,length.out=11),labels=paste(seq(2000,1000,length.out=11)),line=.5)
mtext(side=2,text="Year",line=3)
axis(side=1,at=c(0,1),labels=c("",""),line=.5)
mtext(side=1,text="proxy",line=1)
#legend and close
legend(x=.7,y=.2,c("NA","available"),fill=c("red","white"))
dev.off()
It shows proxies along the x-axis and time along the y-axis. A red dot is plotted whenever a proxy is unavailable in the particular year. Huh? Around 1500, the data becomes quite sparse. How am I supposed to fit a decent statistical model using a regressor matrix that consists mainly of NA‘s? Apparently, there exist sophisticated methods for imputation of missing data but I don’t like to invent data. My approach is rather that if an input is unavailable you cannot use it to build a model. So here’s what I do:
Normalize the proxy data to zero mean and unit standard deviation
Loop through the years 1000 through 2000:
    check which proxies are available for this particular year
    repeat 10 times:
        randomly sample 100 years from the 150 years of observation period
        using only the available proxies, fit a cross-validated lasso model to these 100 observations
        using this model, reconstruct temperature of the particular year
    end
end
So 10000 lasso models have to be fit, possibly using hundreds of predictors. I guess some parallelism is appropriate, conveniently provided by the package multicore (which rocks by the way).
Using this R code
# loop through lines of proxy matrix (years):
#       filter available proxies
#       fit a cv lasso model to observations, using only these proxies
#       reconstruct temperature of the respective year

library(glmnet)
library(multicore)

#read data, remove "year" and lutannt from proxy data
load("../data/data_allproxy1209.Rdata")
load("../data/data_instrument.Rdata")
t.nh <- instrument$CRU_NH_reform
y.inst <- instrument$Year
allproxy1209 <- allproxy1209[,-c(1,grep("lutannt",names(allproxy1209)))]

#normalize proxies
m <- colMeans(allproxy1209,na.rm=T)
sd <- colMeans(allproxy1209^2,na.rm=T)-m^2
allproxy1209 <- scale(allproxy1209,center=m,scale=sqrt(sd))
#intersect years
y.ind <- which(instrument$Year %in% rownames(allproxy1209))
proxy.inst <- allproxy1209[paste(instrument$Year[y.ind]),]
t.nh <- instrument$CRU_NH_reform[y.ind]
y.inst <- y.inst[y.ind]
#erase na's from proxies during observation period
na.ind <- unique(which(is.na(proxy.inst),arr.ind=T)[,1])
if (!is.null(na.ind)) {
    proxy.inst <- proxy.inst[-na.ind,]
    t.nh <- t.nh[-na.ind]
    y.inst <- y.inst[-na.ind]
}

##loop through years 1000...2000 and reconstruct based on available proxies
#function for a single year
recon.fun <- function(y) {
    #remove na columns
    na.col.ind <- which(is.na(allproxy1209[paste(y),]))
    if(length(na.col.ind)==0) na.col.ind <- dim(proxy.inst)[2]+1
    r <- vector()
    for (i in seq(10)) {
        i.cv <- sample(seq(dim(proxy.inst)[1]),100)
        x <- proxy.inst[i.cv,-na.col.ind]
        #fit cv-lasso model and predict
        lasso.model <- cv.glmnet(x=x,y=t.nh[i.cv])
        coefz <- as.matrix(coef(lasso.model,s=lasso.model$lambda.min))
        r <- rbind(r,t(c(1,allproxy1209[paste(y),-na.col.ind])) %*% coefz)
    }
    #return reconstructions
    r
}
recon <- mclapply(seq(1000,2000),recon.fun,mc.cores=8)
save(file="lasso1.Rdata",list=c("recon"))

##plot
load("lasso1.Rdata")
recon <- t(apply(as.matrix(recon),1,unlist))
#open device
jpeg(file="lasso1.jpg",width=500,height=500,quality=100)
plot(NULL,xlim=c(1000,2000),ylim=c(-1,1),xlab="year",ylab="temp. anomaly")
#plot observations
lines(y.inst,t.nh,col="#AAAAFF",lwd=4)
#plot reconstructions
lapply(seq(10),function(z) lines(seq(1000,2000),recon[,z]))
#legend
legend(x=1000,y=1,c("lasso reconst.","observations"),lwd=c(1,4),col=c("black","#AAAAFF"))
#close device
dev.off()
I produced the following plot (see the earlier posts above about where to get the data):
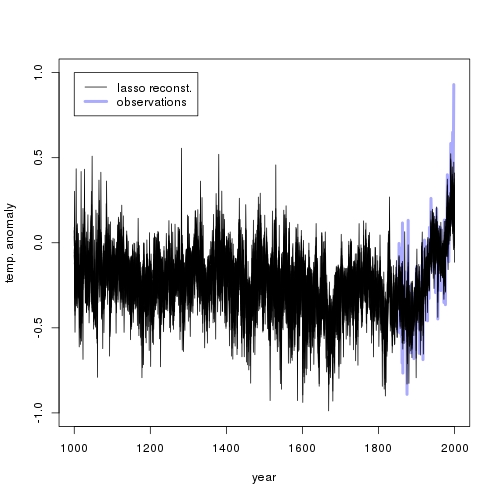
The reconstruction is quite flat (plus noise), except during the observation period where it goes up. It requires some fantasy to see a little ice age or a medieval warm period.
A possible reason for this is that there is no actual relation between temperature observations and proxies. McShane et al. (2011) show that the lasso might fail to shrink coefficients to zero if the corresponding regressor is autocorrelated (which is true for most the proxies). Alternatively, past temperatures might indeed have never been as high as they are today. I should remark that my hockey stick above looks much less frightening than the one from the IPCC report.
R-bloggers.com offers daily e-mail updates about R news and tutorials about learning R and many other topics. Click here if you're looking to post or find an R/data-science job.
Want to share your content on R-bloggers? click here if you have a blog, or here if you don't.