The Hawkes Hand
[This article was first published on rstats – MikeJackTzen, and kindly contributed to R-bloggers]. (You can report issue about the content on this page here)
Want to share your content on R-bloggers? click here if you have a blog, or here if you don't.
Want to share your content on R-bloggers? click here if you have a blog, or here if you don't.
Thanks to Luke Bornn & Tim Swartz, I had the opportunity to present the Hawkes Hand at CASSIS18 . I learned a lot, had a hell of a time & met some great people #RuffRuff . My Hawkes Hand slides are here .
“The Hot Hand is real. If not, why do players even warm up before the game starts?” – Me
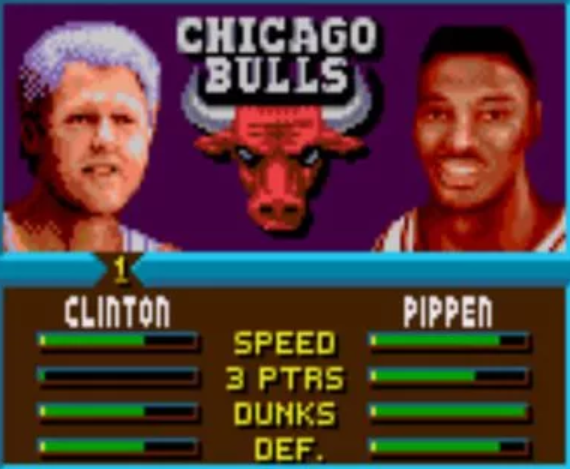
In the 80s, GVT looked at the hot hand through a difference of conditional probabilities that depends on the analyst explicitly conditioning on shooting streak sequences. When the sequence is a string of 3 makes, this is like “NBA Jam,” a video game in the 90s.

Are there alternative ways to frame the hot hand other than conditioning on sequential coin flip orderings (H is a make and T is a miss)? If you observed a HHH sequence you might naturally say that the player was hot. But what if I told you that the made shots were evenly spread across 48 minutes. If the player only attempted and made all 3 shots at the cumulative minute marks of 11:30, 23:30, and 35:30, would you still say that the player was hot in the 4th quarter? Alternatively, even if you observed a miss in the sequence HHT within a short time frame (3 minutes), this could very well provide information towards a player heating up. Temporal information is important when contextualizing shooting streaks of makes or misses, information NOT used by the GVT approach.
A professional NBA player is expected to have world-class ability in judging their own latent psycho-bio-mechancial state, then acting upon it. Seeing a player attempt many shots in a short cluster of time would suggest that the player is in a self-excited shooting state, perhaps self-confident in his shot making ability. Instead of the GVT approach, we use a Hawkes model, a way to model temporal clustering in point processes. Specifically, we use the Epidemic Type Aftershock Sequences model.
ETAS is a special case of the Hawkes model, where the ETAS model allows earthquakes of different magnitudes to have different contributions to productivity. A large magnitude earthquake might generate more aftershocks as opposed to an earthquake with a smaller magnitude. In the Hawkes Hand context, we let the ‘local field goal percentage’ be the ‘magnitude’ of a made shot. A made shot with a higher localized field goal percentage may generate more aftershock-makes than a made shot that had a lower field goal percentage.
Our ETAS approach gives us 2 dimensions of hotness (hawkesness):
1. The productivity parameter in the ETAS model summarizes the average number of aftershock-makes generated by a parent make.
2. The logistic regression parameter links the historical intensity of makes to the local field goal percentage (using a geometric random variable to preserve information about the misses between two makes).
For those reading at home, try to match the 3 games of varying hotness to:
Shuffle {Klay Thompson, Tracy McGrady, Kobe Bryant}
Further, these 2 dimensions of hawkesness suggest that there are a handful of games in the 2005-2006 season where Kobe was hotter than he was for his 81 point game on January 22, 2006 (in red below).
If you were an NBA player, how would you react if the league office got rid of pre-game warmups?
PS, we had another presentation at #CASSIS18 where Aaron talked about relational networks in basketball. Find out more about CoordiNet and Dr. Aaron at https://www.aaronjdanielson.com/
PPS, we used #rstats for all of our analysis and graphics. From the presentations to the posters, many of the presenters used R. Talking with analytics staff (from the NBA, MLB, and the NFL) a lot of them use R in their internal systems.
To leave a comment for the author, please follow the link and comment on their blog: rstats – MikeJackTzen.
R-bloggers.com offers daily e-mail updates about R news and tutorials about learning R and many other topics. Click here if you're looking to post or find an R/data-science job.
Want to share your content on R-bloggers? click here if you have a blog, or here if you don't.


 at
at 


