
Shiny Example – NHL Players
[This article was first published on R – Real Data, and kindly contributed to R-bloggers]. (You can report issue about the content on this page here)
Want to share your content on R-bloggers? click here if you have a blog, or here if you don't.
Want to share your content on R-bloggers? click here if you have a blog, or here if you don't.
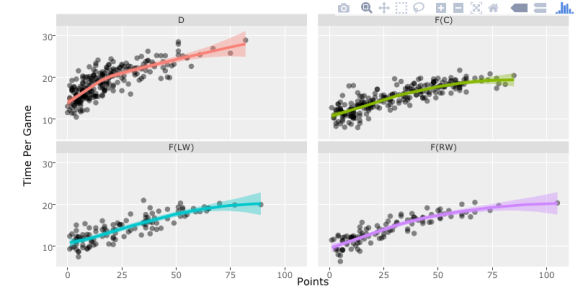
Here’s a little visualization app I made a couple of months back which explores hockey players in the NHL during the 2015 – 2016 season. As we get closer to the end of the regular season this year I’ll take a look at 2017’s players.
See the app here.
See the code behind it here.

To leave a comment for the author, please follow the link and comment on their blog: R – Real Data.
R-bloggers.com offers daily e-mail updates about R news and tutorials about learning R and many other topics. Click here if you're looking to post or find an R/data-science job.
Want to share your content on R-bloggers? click here if you have a blog, or here if you don't.