
R Passes SPSS in Scholarly Use, Stata Growing Rapidly
Want to share your content on R-bloggers? click here if you have a blog, or here if you don't.
by Robert A. Muenchen
Here is my latest update to The Popularity of Data Analysis Software. To save you the trouble of reading all 25 pages of that article, the new section is below. The two most interesting nuggets it contains are:
- As I covered in my talk at the UseR 2014 meeting, it is very likely that during the summer of 2014, R became the most widely used analytics software for scholarly articles, ending a spectacular 16-year run by SPSS.
- Stata has probably passed Statistica in scholarly use, and its rapid rate of growth parallels that of R.
If you’d like to be alerted to future updates on this topic, you can follow me on Twitter, @BobMuenchen.
Scholarly Articles
The more popular a software package is, the more likely it will appear in scholarly publications as a topic and as a method of analysis. The software that is used in scholarly articles is what the next generation of analysts will graduate knowing, so it’s a good leading indicator of where things are headed. Google Scholar offers a way to measure such activity. However, no search of this magnitude is perfect and will include some irrelevant articles and reject some relevant ones. The details of the search terms I used are complex enough to move to a companion article, How to Search For Analytics Articles. Since Google regularly improves its search algorithm, I recollect the data for all years following the protocol described at http://librestats.com/2012/04/12/statistical-software-popularity-on-google-scholar/.
Figure 2a shows the number of articles found for each software package for all the years that Google Scholar can search. SPSS is by far the most dominant package, likely due to its balance between power and ease-of-use. SAS has around half as many, followed by MATLAB and R. Note that the general purpose software MATLAB, Java and Python are included only when found in combination with analytics terms, so view those as much rougher counts than the rest. Neither C nor C++ are included here because it’s very difficult to focus the search compared to the search for jobs above, whose job descriptions commonly include a clear target of skills in “C/C++” and “C or C++”.
From RapidMiner on down, the counts appear to be zero. That’s not the case, but relative to the others, it might as well be.
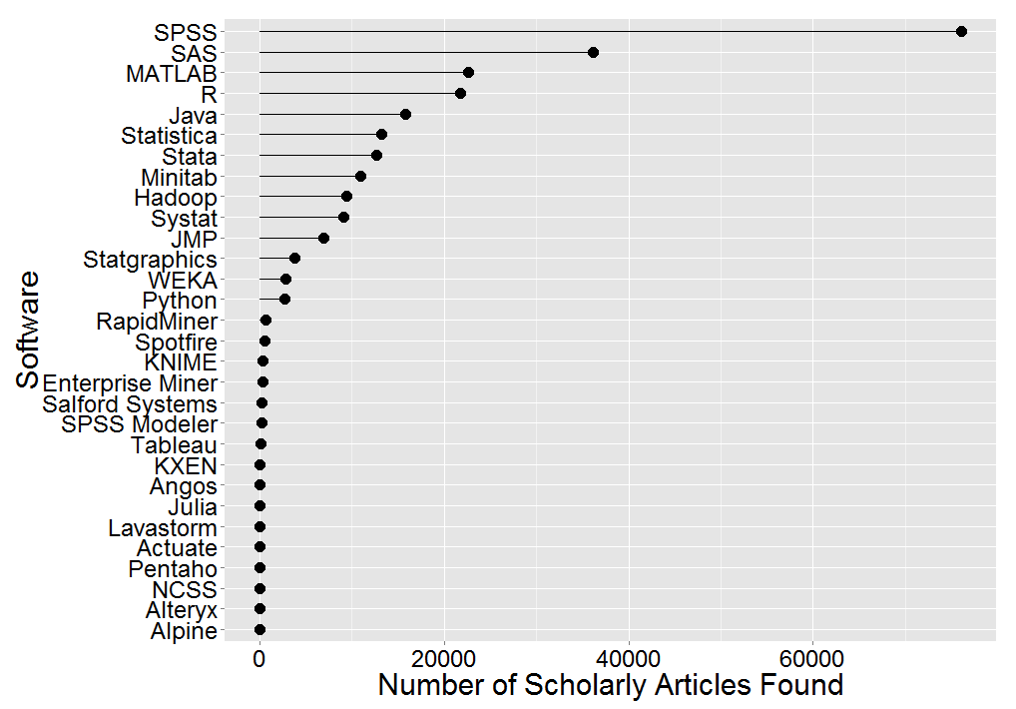
Figure 2a. Number of scholarly articles found for each software.
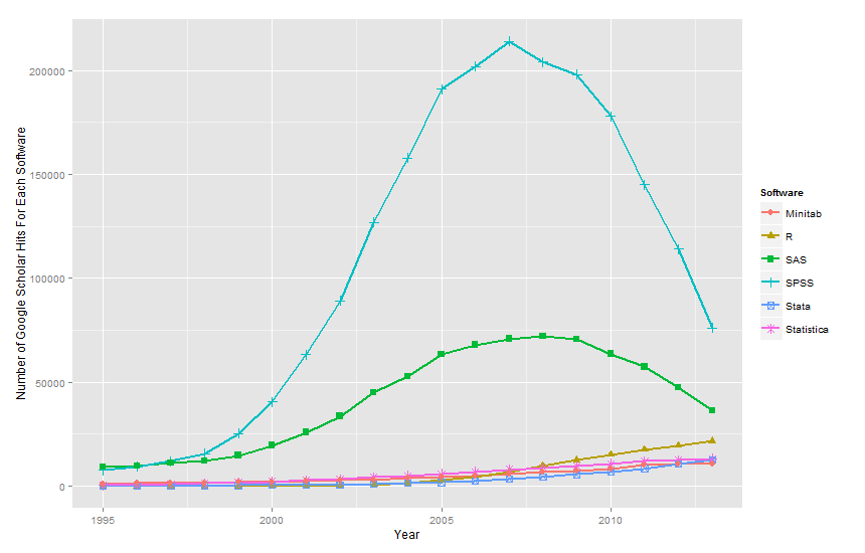
Figure 2b shows the number of articles for the most popular six classic statistics packages from 1995 through 2013 (the last complete year of data this graph was made). As in Figure 2a, SPSS has a clear lead, but you can see that its dominance peaked in 2007 and its use is now in sharp decline. SAS never came close to SPSS’ level of dominance, and it peaked in 2008.
-

Figure 2b. Number of scholarly articles found for the top five classic statistics packages.
Since SAS and SPSS dominate the vertical space in Figure 2a by such a wide margin, I removed those two packages and added the next two most popular statistics packages, Systat and JMP in Figure 2c. Freeing up so much space in the plot now allows us to see that the use of R is experiencing very rapid growth and is pulling away from the pack, solidifying its position in third place. In fact, extending the downward trend of SPSS and the upward trend of R make it likely that sometime during the summer of 2014 R became the most dominant package for analytics used in scholarly publications. Due to the lag caused by the publication process, getting articles online, indexing them, etc. we won’t be able to verify that this has happened until well into 2014.
After R, Statistica is in fourth place and growing, but at a much lower rate. Note that in the plots from previous years, Statistica was displayed as a flat line at the very bottom of the graph. That turned out to be a search-related artifact. Many academics who use Statistica don’t mention the package by software name but rather say something like, “we used the statistics package by Statsoft.”
Extrapolating from the trend lines, it is likely that the use of Stata among academics passed that of Statistica fairly early in 2014. The remaining three packages, Minitab, Systat and JMP are all growing but at a much lower rate than either R or Stata.

Figure 2c. Number of scholarly articles that reference each software by year, after removing the top two, SPSS and SAS, and adding the next two most popular, Systat and JMP.

R-bloggers.com offers daily e-mail updates about R news and tutorials about learning R and many other topics. Click here if you're looking to post or find an R/data-science job.
Want to share your content on R-bloggers? click here if you have a blog, or here if you don't.