R: Function to create tables in LaTex or Lyx to display regression model results
Want to share your content on R-bloggers? click here if you have a blog, or here if you don't.
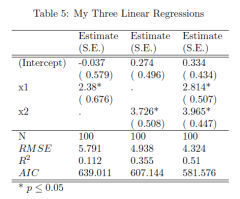
 Most people using LaTex feel that creating tables is no fun. Some days ago I stumbled across a neat function written by Paul Johnson that produces LaTex code as well as LaTex code that can be used within Lyx. The output can be used for regression models and looks like output from the Stata outreg command. His R function that produces the LaTex code has the same name: outreg(). The outreg code can be found on his website or in the PDF copy of the code from his website.
I took the code, put it into a .rnw file and sweaved it. It worked like a charm and produced beautiful results (see the picture on the left and the PDF). Below you can find the code for the noweb file (.rnw). Latex code is colored grey, R-code is colored blue. Just have a look at all the results as a PDF file. Besides, Paul Johnson has also created a nice list of R-Tips that can be found on his website as well.
###############################################################

\documentclass[a4paper,10pt]{article}

\title{Regression Tables for LaTex}
\author{Mark Heckmann. Code by Paul Johnson}
\date{\today}

\begin{document}
\maketitle

<<echo=FALSE>>=
x1 <- rnorm(100)
x2 <- rnorm(100)
y1 <- 5*rnorm(100)+3*x1 + 4*x2
y2 <- rnorm(100)+5*x2
m1 <- lm (y1~x1)
m2 <- lm (y1~x2)
m3 <- lm (y1 ~ x1 + x2)
gm1 <- glm(y1~x1)
@

<<echo=FALSE, results=tex>>=
 outreg(m1,title="My One Tightly Printed Regression", lyx=F )
 outreg(m1,tight=F,modelLabels=c("Fingers"),
        title="My Only Spread Out Regressions" ,lyx=F)
 outreg(list(m1,m2),modelLabels=c("Mine","Yours"),
        varLabels=list(x1="Billie"),
        title="My Two Linear Regressions Tightly Printed" ,lyx=F)
 outreg(list(m1,m2),modelLabels=c("Whatever","Whichever"),
        title="My Two Linear Regressions Not Tightly  Printed",
        showAIC=F, lyx=F)
 outreg(list(m1,m2,m3),title="My Three Linear Regressions", lyx=F)
 outreg(list(m1,m2,m3),tight=F,
        modelLabels=c("I Love love love really long titles",
        "Hate Long","Medium"), lyx=F)
 outreg(list(gm1),modelLabels=c("GLM"), lyx=F)
 outreg(list(m1,gm1),modelLabels=c("OLS","GLM"), lyx=F)
@

\end{document}

###############################################################
R-bloggers.com offers daily e-mail updates about R news and tutorials about learning R and many other topics. Click here if you're looking to post or find an R/data-science job.
Want to share your content on R-bloggers? click here if you have a blog, or here if you don't.
