
Plot the density of predicted values for presences and absences
[This article was first published on modTools, and kindly contributed to R-bloggers]. (You can report issue about the content on this page here)
Want to share your content on R-bloggers? click here if you have a blog, or here if you don't.
Want to share your content on R-bloggers? click here if you have a blog, or here if you don't.
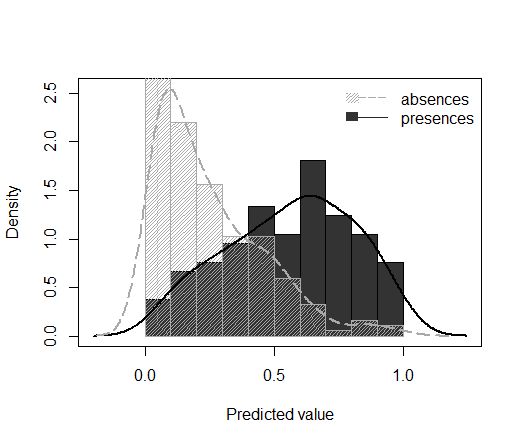
The ‘predDensity’ function, included in the modEvA package since version 1.5 (currently available on R-Forge), produces a histogram and/or a kernel density plot of predicted values for observed presences and absences in a binomial GLM:
predDensity <- function (model = NULL, obs = NULL, pred = NULL, separate = TRUE,
  type = c("both"), legend.pos = "topright")
{
  if (!is.null(model)) {
    if (!("glm" %in% class(model)) || family(model)$family !=
      "binomial")
      stop("'model' must be of class 'glm' and family 'binomial'.")
    if (!is.null(obs))
      message("Argument 'obs' ignored in favour of 'model'.")
    if (!is.null(pred))
      message("Argument 'pred' ignored in favour of 'model'.")
    obs <- model$y
    pred <- model$fitted.values
  }
  if (is.null(obs)) {
    if (is.null(pred))
      stop("You must provide either 'model' or 'pred'.")
    separate <- FALSE
    obs <- sample(c(0, 1), length(pred), replace = TRUE)
  }
  else {
    if (length(obs) != length(pred))
      stop("'obs' and 'pred' must have the same length.")
  }
  pred0 <- pred[obs == 0]
  pred1 <- pred[obs == 1]
  type <- match.arg(type, c("histogram", "density", "both"))
  rslt <- vector("list")
  if (type %in% c("density", "both")) {
    if (!separate) {
      dens <- density(pred)
      xrange <- range(dens$x, finite = TRUE)
      yrange <- range(dens$y, finite = TRUE)
      rslt[["density"]] <- dens
    }
    else {
      dens0 <- density(pred0)
      dens1 <- density(pred1)
      xrange <- range(dens0$x, dens1$x, finite = TRUE)
      yrange <- range(dens0$y, dens1$y, finite = TRUE)
      rslt[["density_obs1"]] <- dens1
      rslt[["density_obs0"]] <- dens0
    }
    plot(x = xrange, y = yrange, xlab = "Predicted value",
      ylab = "Density", type = "n")
  }
  if (type %in% c("histogram", "both")) {
    hist0 <- hist(pred0, plot = FALSE)
    hist1 <- hist(pred1, plot = FALSE)
    if (type == "histogram") {
      yrange <- range(hist0$density, hist1$density, finite = TRUE)
      plot(x = c(0, 1), y = yrange, type = "n", xlab = "Predicted value",
        ylab = "Density")
    }
    if (!separate) {
      histogram <- hist(c(pred0, pred1), freq = FALSE,
        col = "grey20", add = TRUE)
      rslt[["histogram"]] <- histogram
    }
    else {
      hist(pred1, freq = FALSE, col = "grey20", add = TRUE)
      hist(pred0, freq = FALSE, col = "darkgrey", density = 40,
        angle = 45, add = TRUE)
      rslt[["histogram_obs1"]] <- hist1
      rslt[["histogram_obs0"]] <- hist0
      if (legend.pos != "n" && type == "histogram")
        legend(legend.pos, legend = c("absences", "presences"),
          fill = c("darkgrey", "grey20"), border = NA,
          density = c(40, NA), bty = "n")
    }
  }
  if (type %in% c("density", "both")) {
    if (!separate) {
      lines(dens, col = "black", lwd = 2)
    }
    else {
      lines(dens1, col = "black", lwd = 2)
      lines(dens0, col = "darkgrey", lty = 5, lwd = 2)
      if (legend.pos != "n" && type == "density")
        legend(legend.pos, legend = c("absences", "presences"),
          col = c("darkgrey", "black"), lty = c(5, 1),
          bty = "n")
      if (legend.pos != "n" && type == "both")
        legend(legend.pos, legend = c("absences", "presences"),
          fill = c("darkgrey", "grey20"), border = NA,
          lty = c(5, 1), col = c("darkgrey", "grey15"),
          density = c(40, NA), bty = "n")
    }
  }
  return(rslt)
}
Usage example:
install.packages("modEvA", repos="http://R-Forge.R-project.org")
library(modEvA)
data(rotif.mods)
predDensity(model = rotif.mods$models[[3]])
To leave a comment for the author, please follow the link and comment on their blog: modTools.
R-bloggers.com offers daily e-mail updates about R news and tutorials about learning R and many other topics. Click here if you're looking to post or find an R/data-science job.
Want to share your content on R-bloggers? click here if you have a blog, or here if you don't.